plot_signal() gallery QA
Release and purpose
These examples use the fastphylosig 0.3.0 public functions and their native
base-R plot_signal() output. The data are seeded demonstrations intended to
show the available diagnostic styles; their statistics are not benchmark claims
or biological findings.
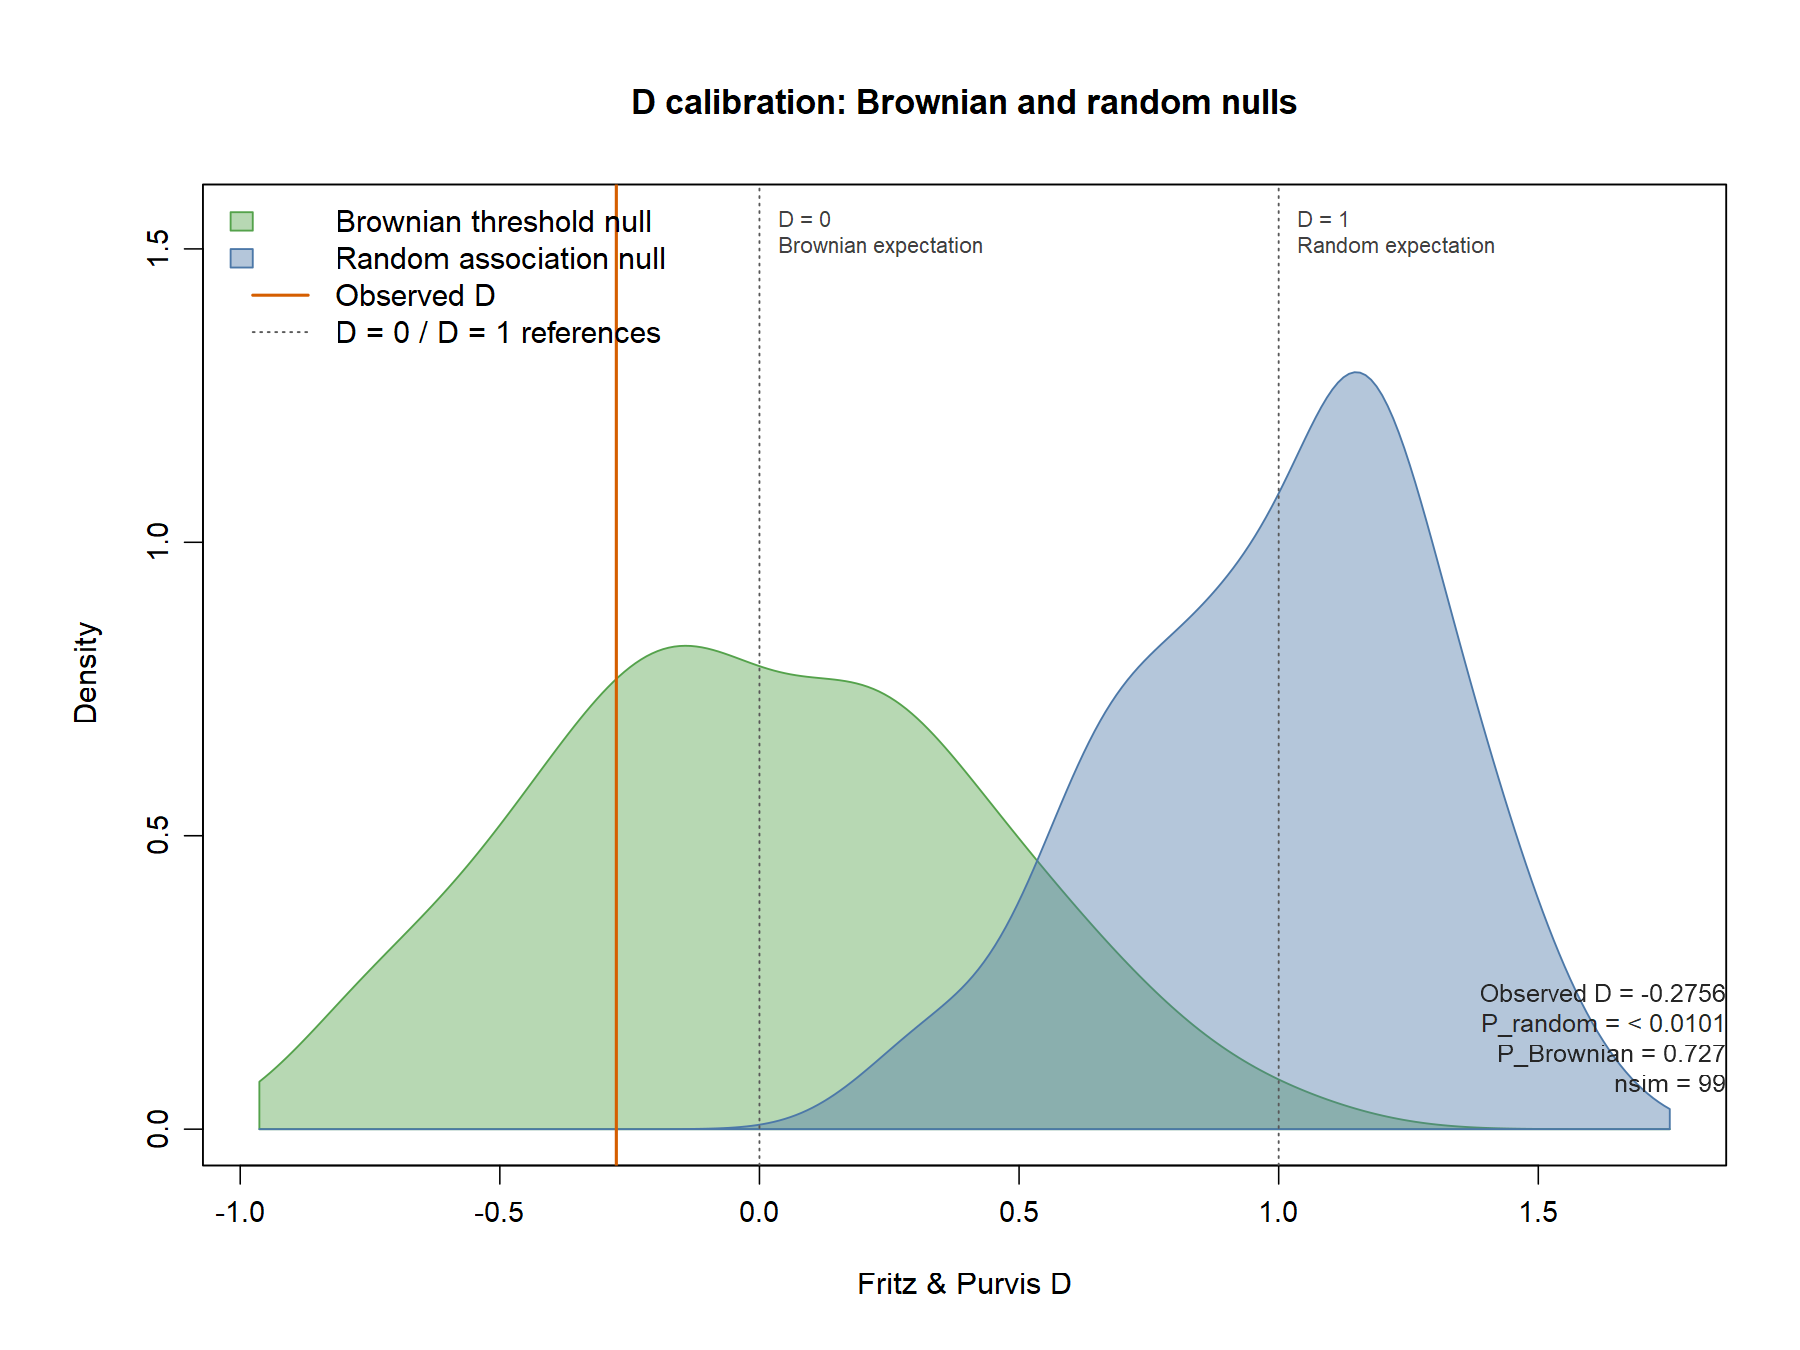
The overview is a 2-by-2 arrangement of the multi-trait K permutation ridges, lambda profile, D null calibration overlay, and Delta permutation illustration. Individual files provide the single-trait K, multi-trait K, lambda profile, D overlay, D single-null choices, and Delta styles.
Overview
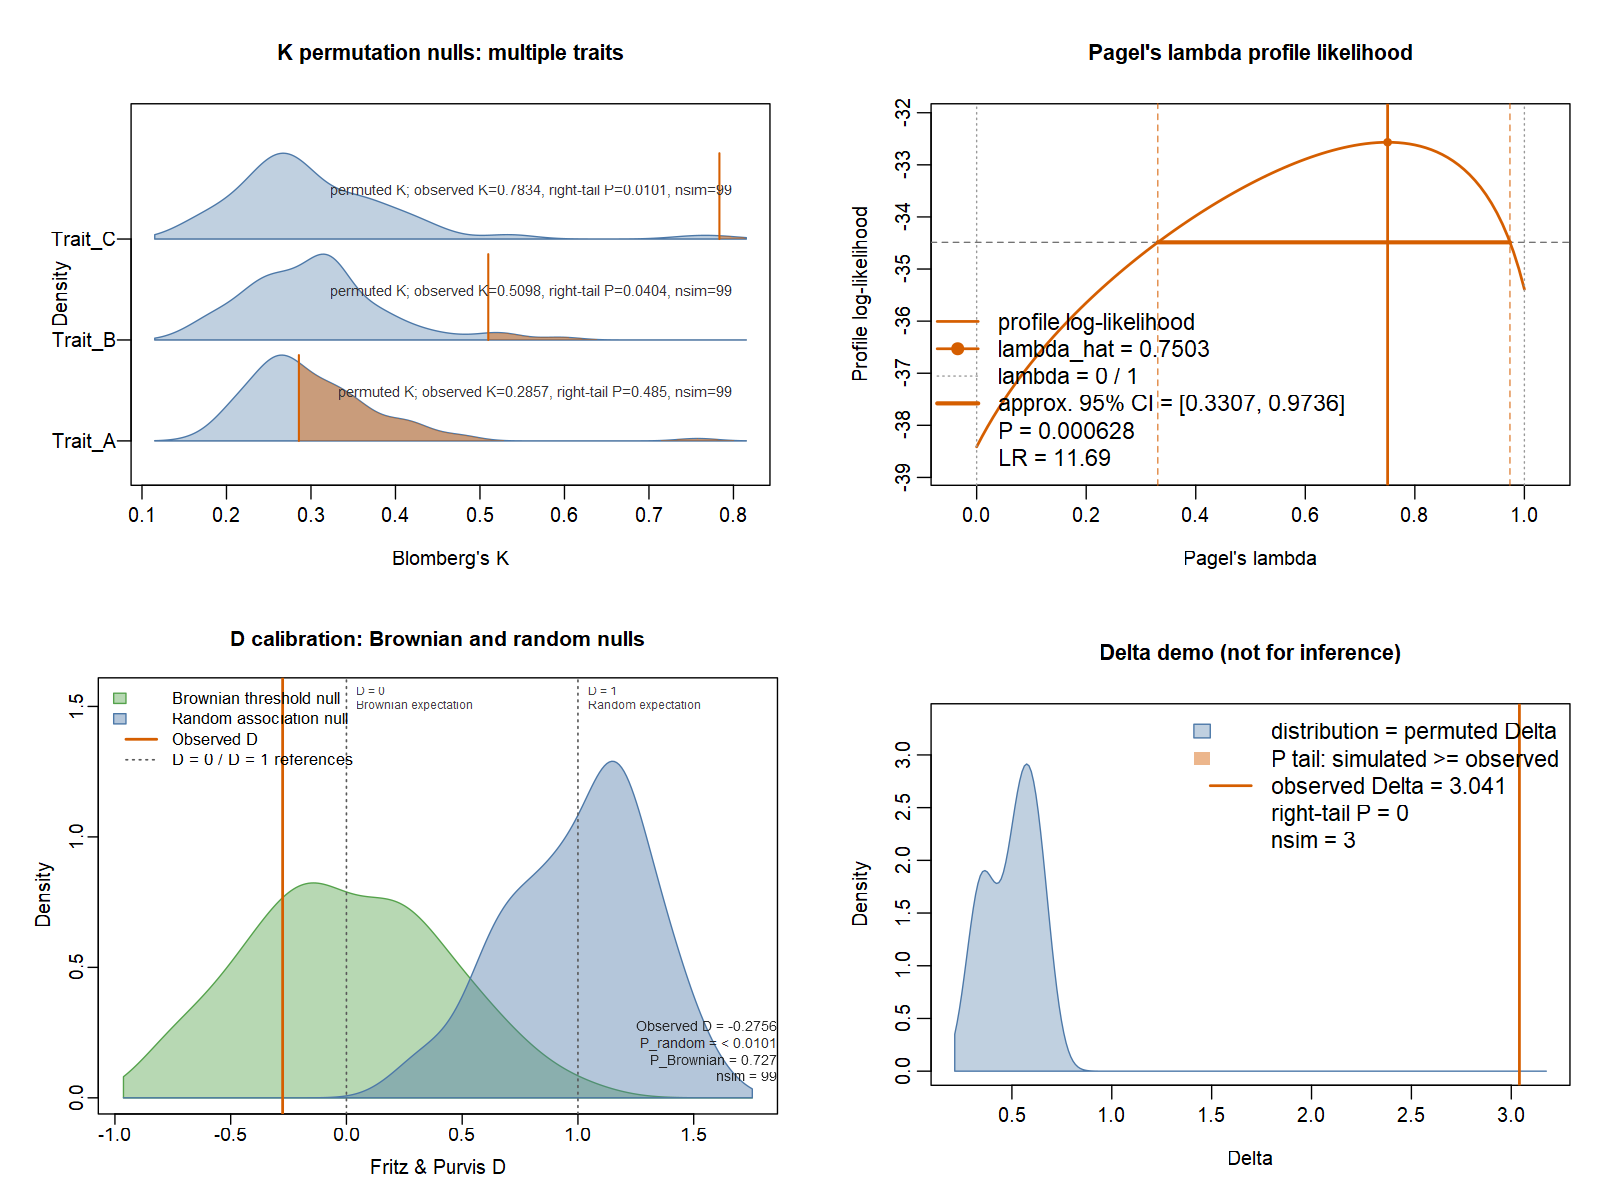
PNG: 1600 x 1200 px. Vector exports: SVG and PDF.
Individual styles
K permutation, one trait
K permutation, multiple traits
Pagel’s lambda profile
D calibration overlay
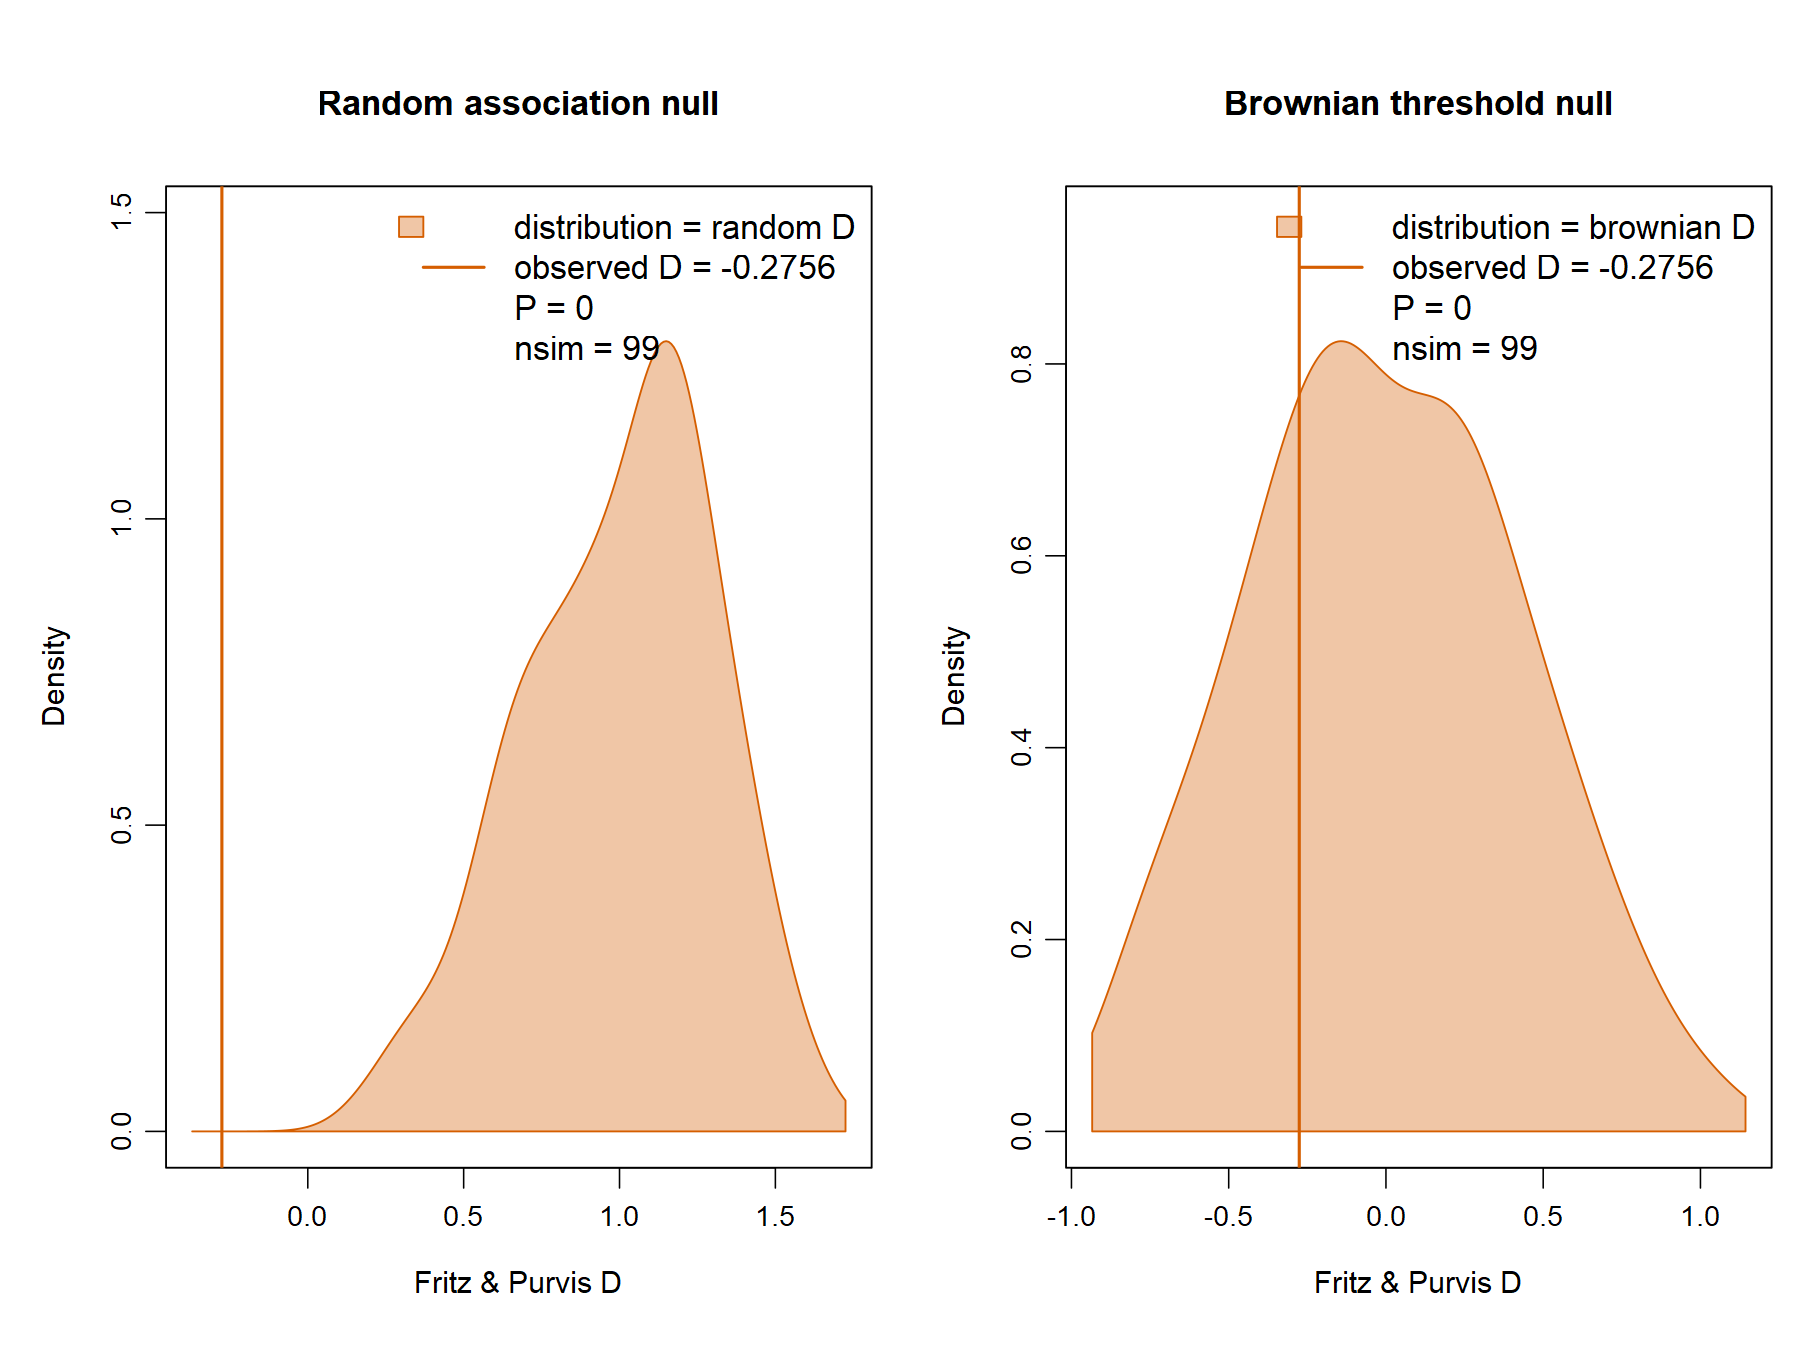
D single-null views
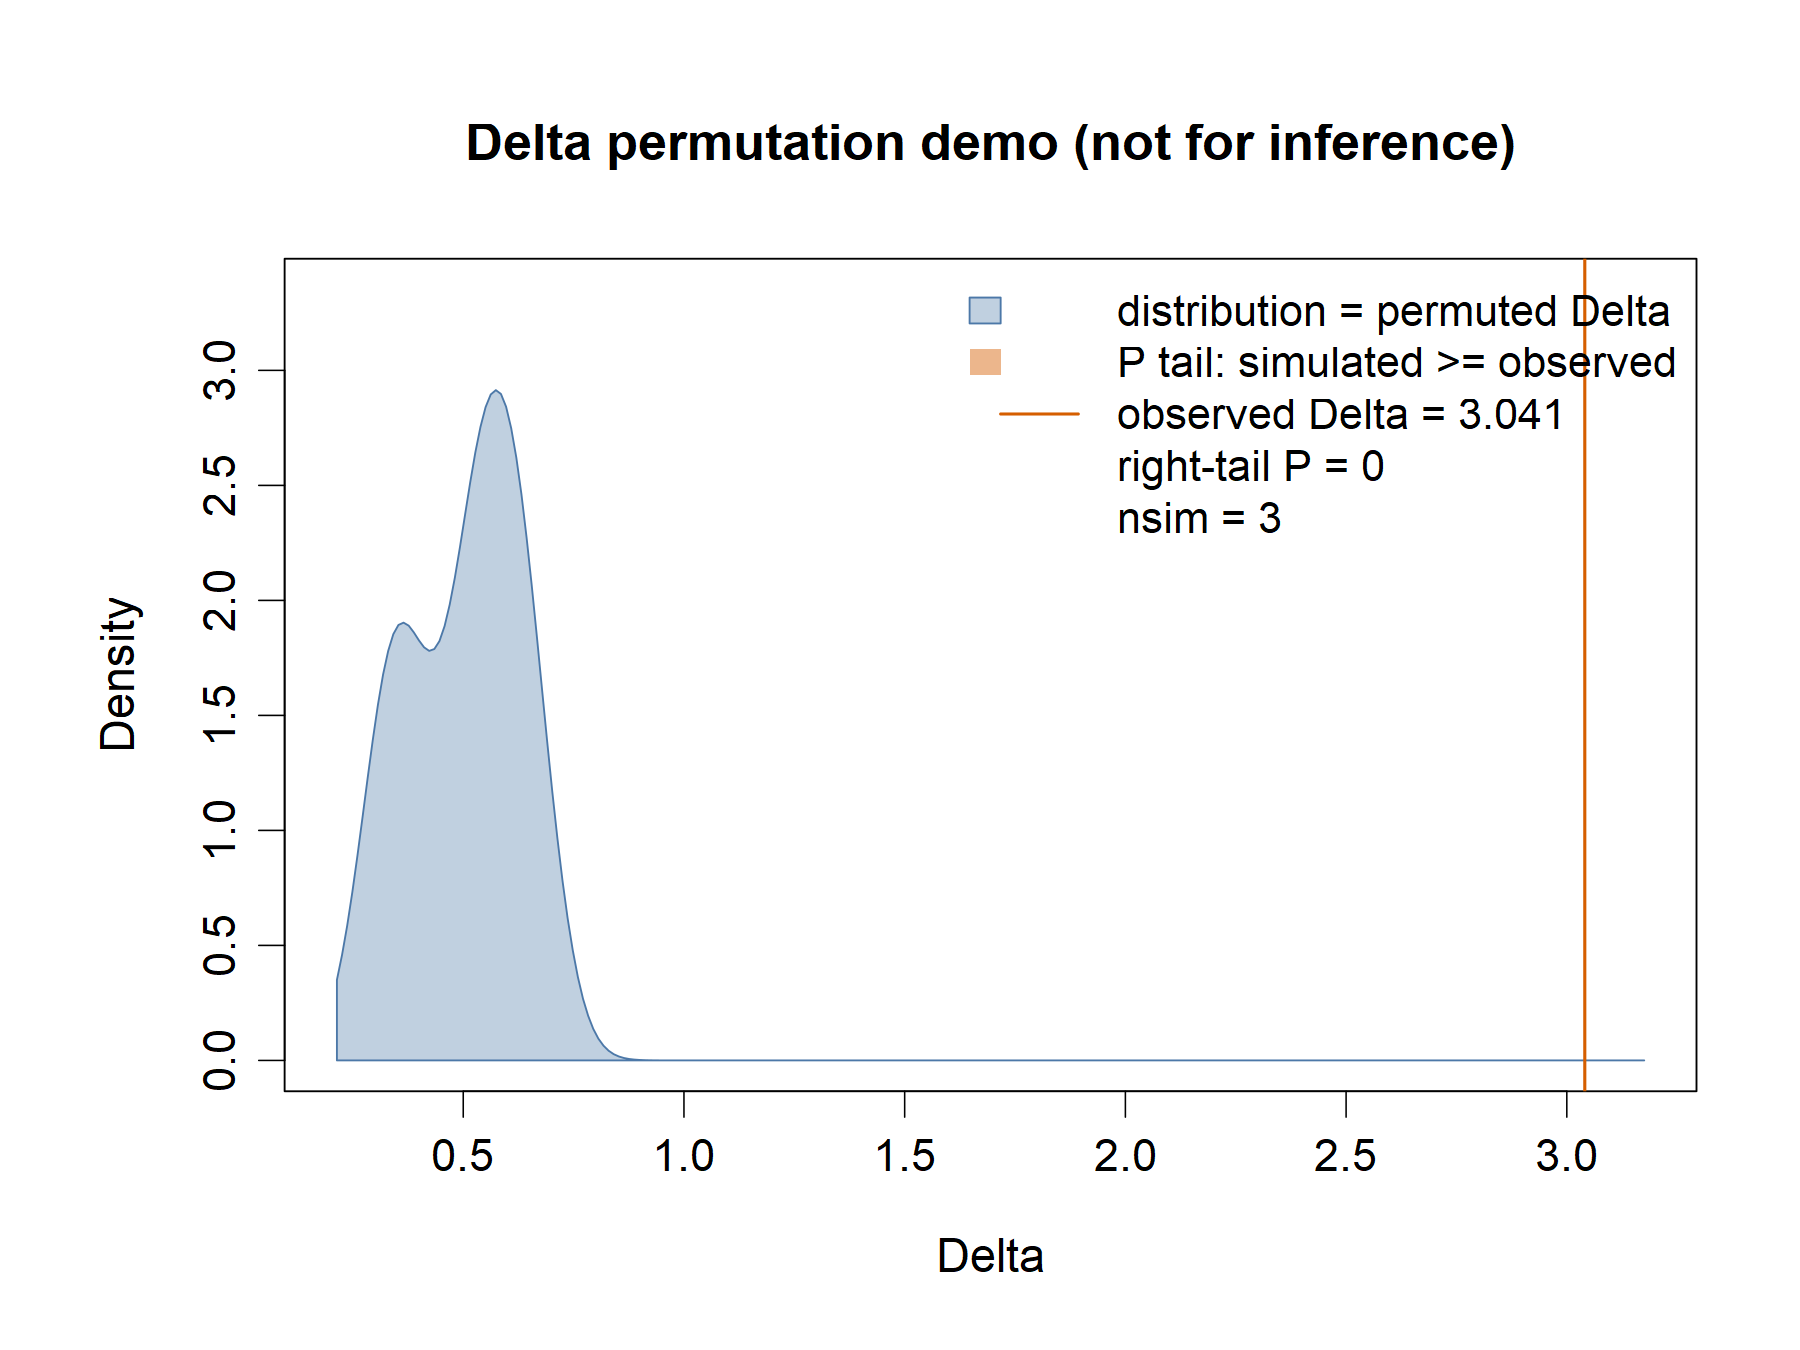
Categorical Delta permutation
Each individual PNG is 1800 x 1350 px; each also has SVG and PDF exports.
Reproducible demonstration settings
The script records its inputs in plot_signal_demo_data.rds,
plot_signal_demo_traits.csv, and plot_signal_demo_tree.nwk. It writes the
observed estimates, P values, permutation counts, seeds, and Delta diagnostics
to plot_signal_gallery_summary.csv.
| Analysis | Tips | Simulation / profile settings | Seed |
|---|---|---|---|
| K, single and multi-trait | 32 | 99 permutations | 20261002 |
| Pagel’s lambda profile | 32 | 101 profile points; deterministic likelihood profile | 20261002 |
| D | 32 | 99 random and 99 Brownian simulations | 20261003 |
| Categorical Delta | 32 | 3 permutations; mcmc_sim = 60, thin = 10, burn = 20 |
20261004 |
Trait/tree generation seed: 20261001. The Delta sample size and chain length are deliberately small so the plot can be reproduced quickly. Its plotted permutation P value is only based on three draws and must not be interpreted.
The Delta run emitted this diagnostic warning:
Delta MCMC diagnostics require inspection for 1 trait: x (ESS_alpha < 20; ESS_beta < 20; split_Rhat_beta > 1.1). Estimates are returned unchanged; no MCMC chains were rerun. Inspect ESS, split R-hat, and MCSE_Delta before interpretation.
Accordingly, the Delta panel is marked not for inference. The short chain
and three permutations are shown only to demonstrate how plot_signal()
displays categorical Delta output.
Visual QA
- The version check in the script requires
fastphylosig0.3.0 and confirms theplot_signal(),fast_signal(),fast_d(), andfast_delta()exports. - The package-generated PNGs were opened for visual review. The multi-trait labels fit after using concise neutral trait names; the overview contains all four panels, and its axes and panel titles are visible.
- The overview keeps the package’s native labels. For an extreme observed K, its vertical observed-value line can pass close to the native right-side permutation annotation; this is retained and documented rather than edited after rendering. The individual figure is larger for inspection.
- D and lambda panels retain their built-in legends, reference lines, and statistic labels. Delta’s deliberately limited Monte Carlo settings and diagnostic warning are stated above.
- PNG, SVG, and PDF files were exported from R graphics devices. No plot was reconstructed or edited in another drawing backend.
Reproduction
From the package repository root, run:
Rscript --vanilla docs/release-0.3.0/plot_signal_gallery.R --library=PATH_TO_FASTPHYLOSIG_0_3_0 --library=PATH_TO_DEPENDENCIES
The script stops unless the loaded package version is exactly 0.3.0. It uses a
fixed seed, recreates the demo data and fits, then regenerates the images and
summary files in docs/release-0.3.0/. Use --outdir=<directory> to choose a
different output location.
Final audit status (2026-10-02)
This is a preview gallery of native package output, not a collision-free manuscript figure set and not certified for journal submission. Native statistic annotations intersect plotted lines or density edges in several styles; they were retained rather than rewriting the package plotting function. The measured overview alignment also fails the 1.5 pt gate. These limitations are visible to readers and are not waived as passes.
Reproducibility and input integrity
The final R run exited 0, enforced fastphylosig 0.3.0, and used 32 tips. No
tree, trait, seed, statistic, or production plotting code changed. The
deterministic inputs and summary were byte-identical before and after rerun:
| File | SHA-256 |
|---|---|
plot_signal_demo_traits.csv |
49709fe6a138886b78de46d739c1119fe82f724a0abd1a7008016d7a39210036 |
plot_signal_demo_tree.nwk |
c04797c52792d478eb41ced4a86a5e2eb678633f0b6c0693b54172d71a2396cb |
plot_signal_demo_data.rds |
65e8f6a861b893d1779ffa0419f3d6bc0e1e3128601a33e35af75da282220449 |
plot_signal_gallery_summary.csv |
b3d14ce28208065de13b8159abdfc75d2dac33484195ca0b893e5ec8a759a04b |
The overview rectangles were measured by R on the final 12 x 9 inch PDF device.
The strict alignment audit reports FIX BEFORE DELIVERY (2 failures):
row 2 has 14.0 pt top, 15.5 pt bottom, and 29.6 pt plot-height spreads; column
1 has 17.7 pt left-edge and 21.8 pt plot-width spreads. The smaller D-overlay
text configuration changes its plot-area margins relative to the other
panels. The actual manifest and report are
plot_signal_gallery_overview_alignment-layout.json and
plot_signal_gallery_overview_alignment.json.
Rendered PDF collision audit
All seven PDFs were audited after the final R export, then all PNGs were
visually reviewed at their exported dimensions (overview 1600 x 1200 px;
individual plots 1800 x 1350 px). Findings are preserved in the corresponding
*_collision_audit.json files.
| Figure | Text-stroke FAIL | Text-fill-edge WARN | Visual review |
|---|---|---|---|
| Overview | 16 | 6 | All four panels/titles/axes visible; it inherits native K, lambda, and D annotation collisions. |
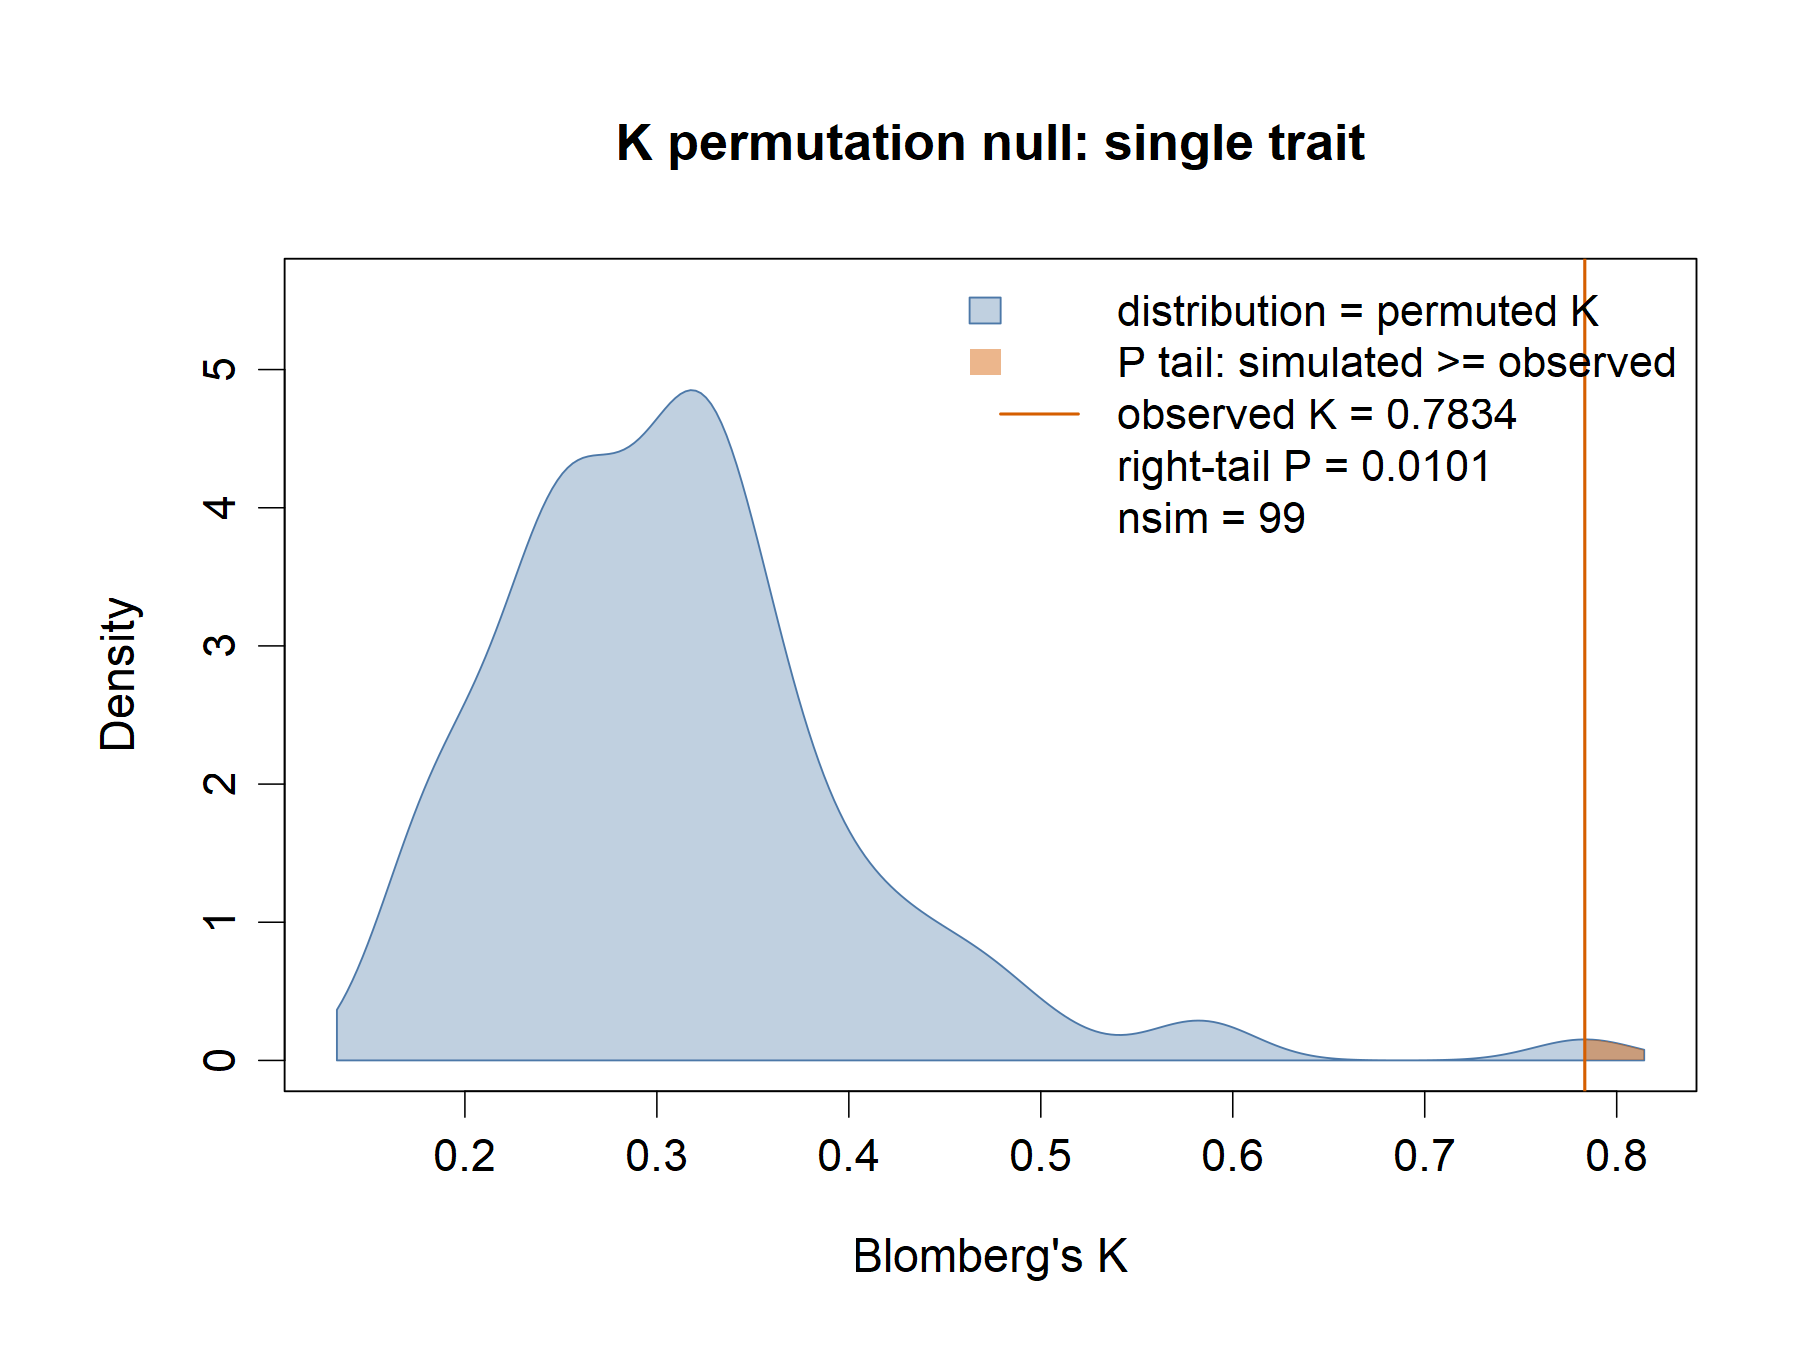
| K single trait | 2 | 0 | Observed-value line crosses the native upper-right legend text. |
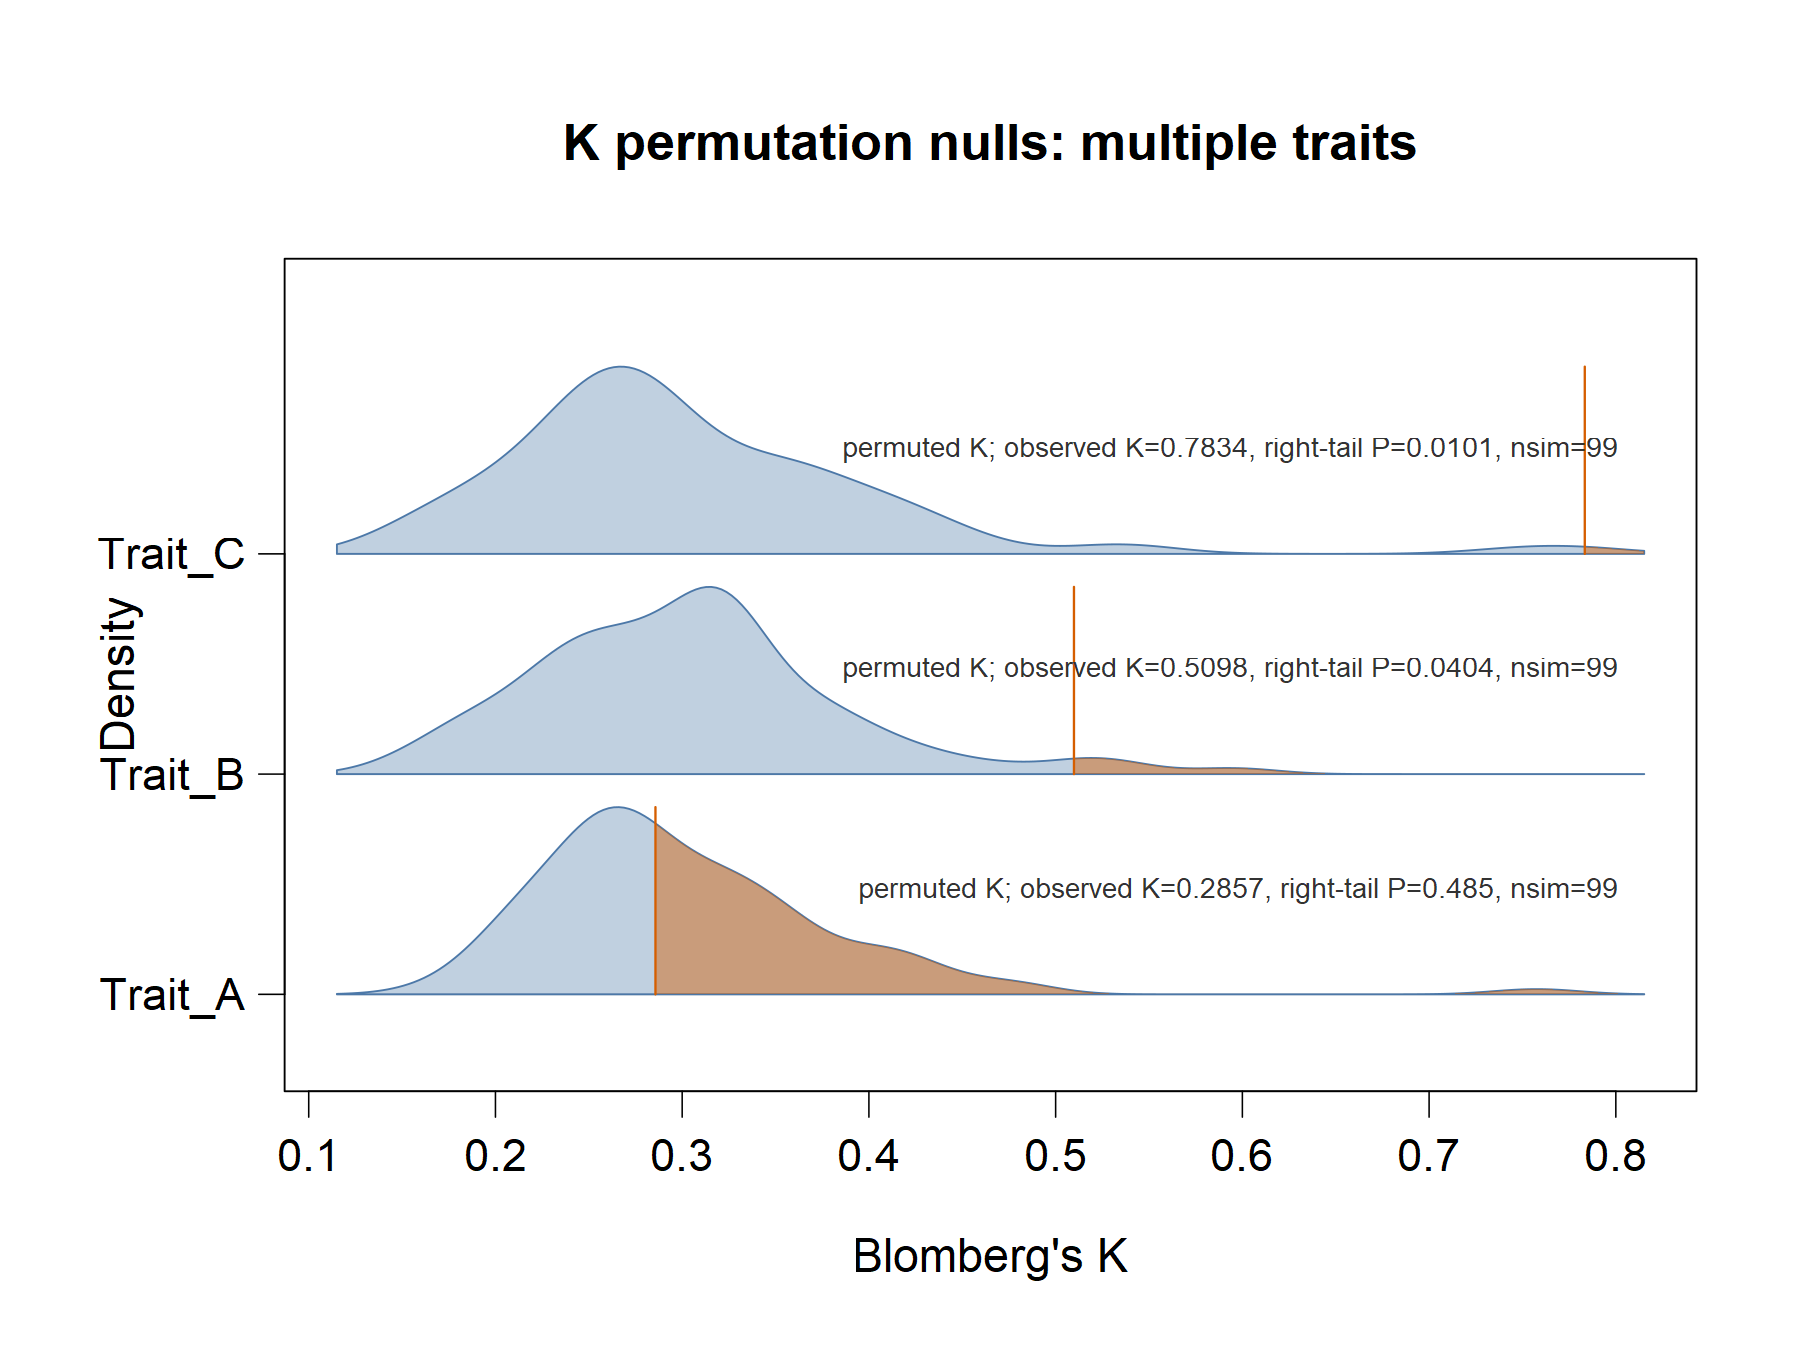
| K multi-trait | 1 | 0 | Trait labels fit; the Trait_C observed line contacts its native statistic annotation. |
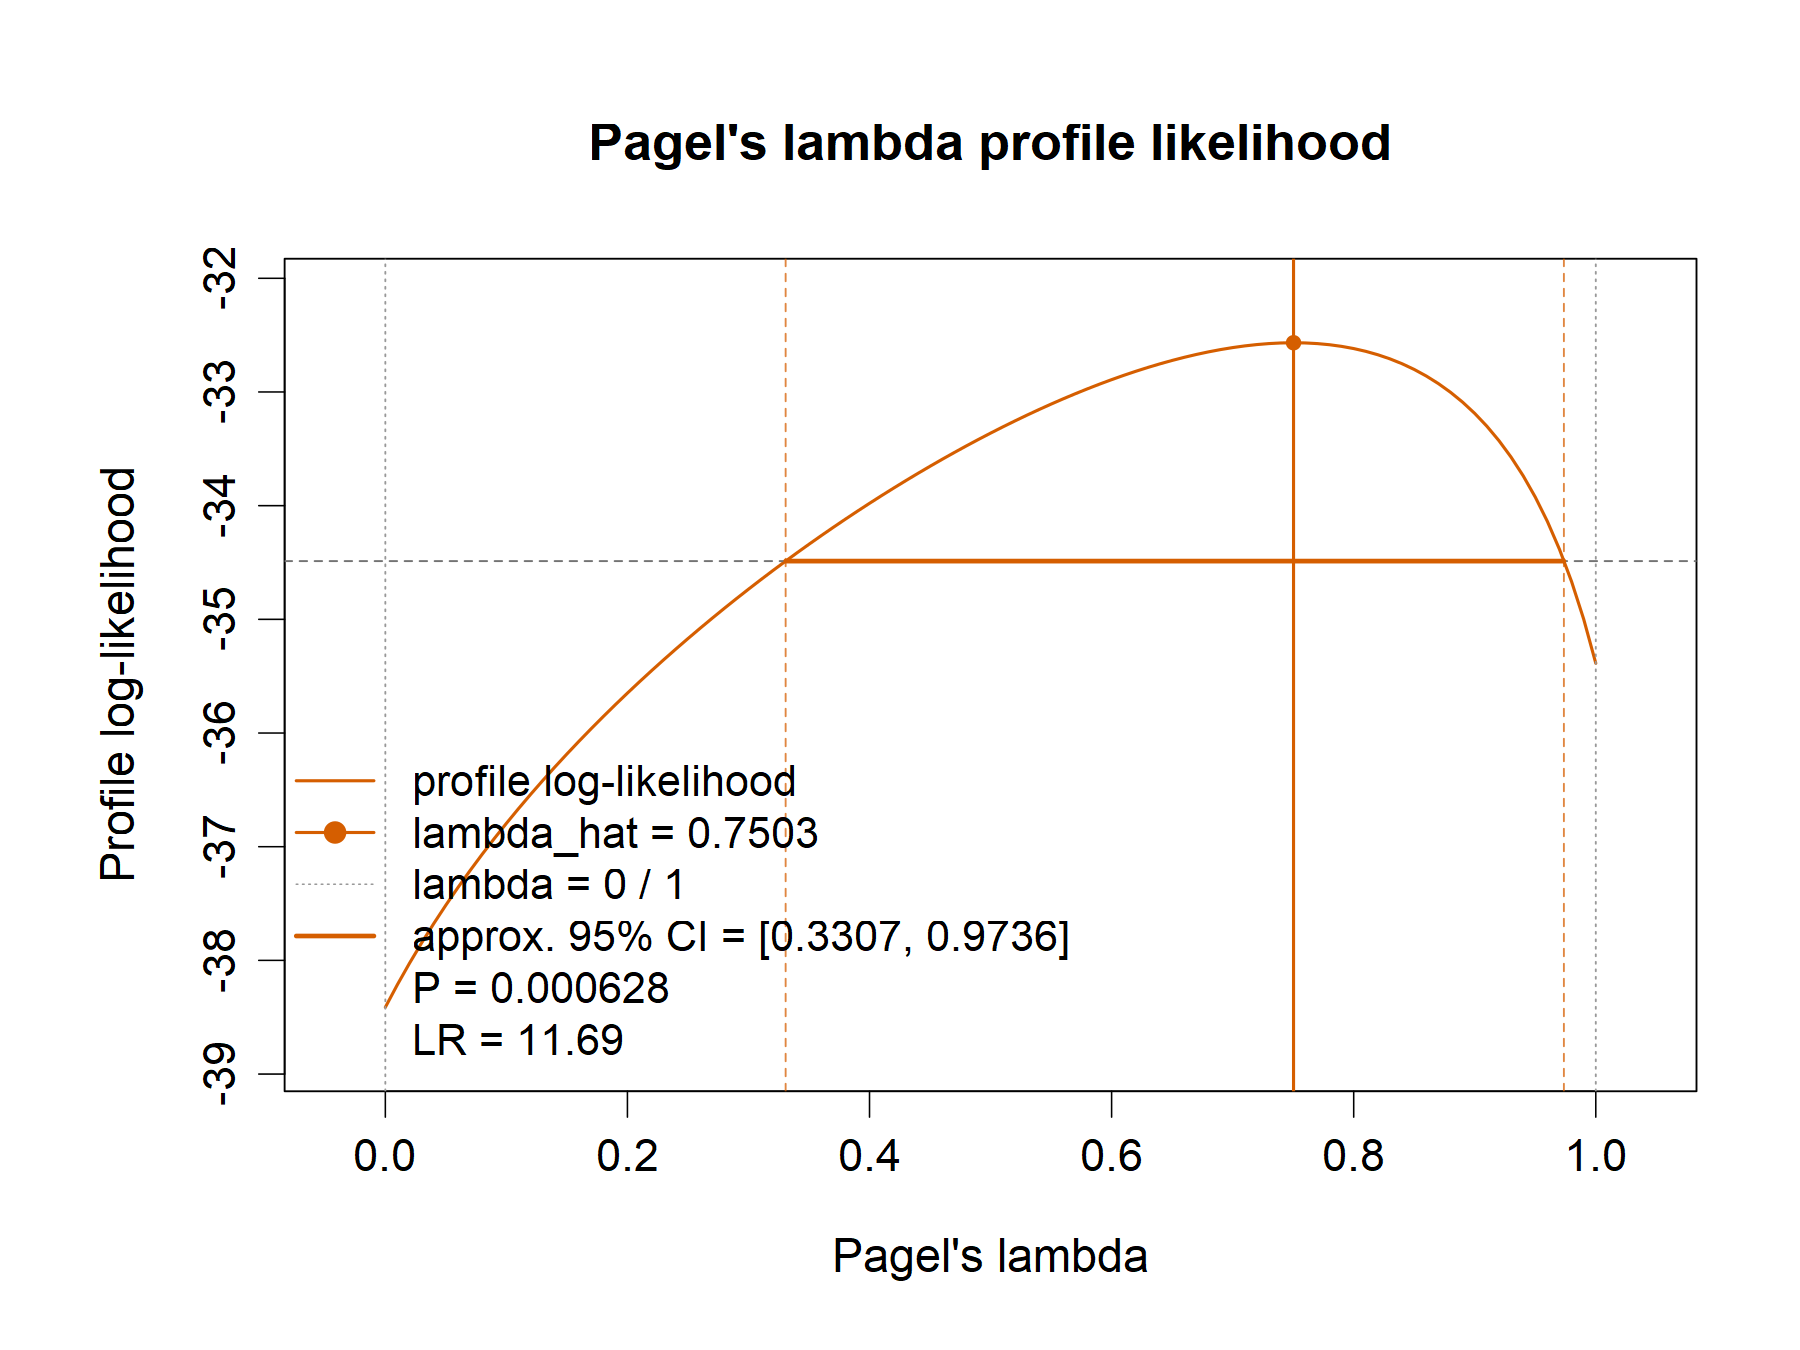
| Lambda profile | 6 | 0 | Profile/reference lines cross the built-in statistic legend. |
| D overlay | 4 | 0 | Statistic block is crowded against the filled distributions at the lower-right edge. |
| D single-null views | 0 | 0 | Both panels and labels are visible; collision audit PASS. |
| Delta demo | 3 | 0 | Observed-value line crosses the native upper-right legend; title says not for inference. |
All collision FAILs are text-stroke; the overview WARNs are text-fill-edge.
They are reported as real native-output collisions, not silently waived. The
D single-null view is the only individual plot with no collision findings.
No plot was post-processed or redrawn in another backend.
PDF text-size cross-check
audit_pdf_text.py was run on all seven PDFs. It exits 1 and reports Tf = 1
pt for every text run. For these R base-graphics PDFs, effective glyph scale
is encoded in text matrices, so the Tf-only result is not the effective
rendered size. An independent PyMuPDF text-span check found the following
minimum effective sizes; no span was below 5 pt. This cross-check does not
change the audit_pdf_text.py failure into a pass.
| Text runs | Tf-only minimum | PyMuPDF minimum | Spans below 5 pt | |
|---|---|---|---|---|
| Overview | 86 | 1 pt (86 flagged) | 6 pt | 0 |
| K single trait | 21 | 1 pt (21 flagged) | 16 pt | 0 |
| K multi-trait | 17 | 1 pt (17 flagged) | 10 pt | 0 |
| Lambda profile | 23 | 1 pt (23 flagged) | 16 pt | 0 |
| D overlay | 25 | 1 pt (25 flagged) | 8 pt | 0 |
| D single-null views | 32 | 1 pt (32 flagged) | 11 pt | 0 |
| Delta demo | 21 | 1 pt (21 flagged) | 16 pt | 0 |
Static source preflight
validate_figure.py reports 11 PASS, 8 WARN, and 2 FAIL. The two recorded
FAILs (EDITABLE-TEXT, EXPORT-VECTOR) arise because this native base-R
script calls grDevices::svg() and grDevices::pdf(), while the static
heuristic only recognizes preferred svglite/cairo_pdf patterns; SVG and
PDF files were nevertheless produced. All eight WARNs are retained and
accounted for: (1) the static syntax warning is superseded by the successful
R 0.3.0 script execution, not by the static check itself; (2) no literal font
size was detected, so effective PDF span sizes were cross-checked separately
with PyMuPDF; (3) lowercase low/middle/high are factor levels; (4) no
TIFF was exported because these are web previews; (5) raster DPI is computed
from dimensions rather than set as a literal, yielding about 133 dpi for the
overview and 150 dpi for details; (6) the width heuristic did not detect the
device declaration, which is 12 x 9 inches; (7) demo data are intentionally
simulated with a fixed seed; and (8) error bars are not applicable to these
permutation-null/profile distributions. The validator’s static panel-alignment
PASS is not treated as authoritative: the separate R-measured geometry audit
fails the 1.5 pt alignment gate as reported above.