fastphylosig 0.3.0 examples and performance
The frozen release is v0.3.0, source commit 0bf0c1520c42d3f0cefb359a8baa970897f3544a.
This directory contains presentation material generated after release. It is excluded from the R source package by .Rbuildignore; updates here do not replace the validated release artifact or move its tag.
Benchmark interpretation
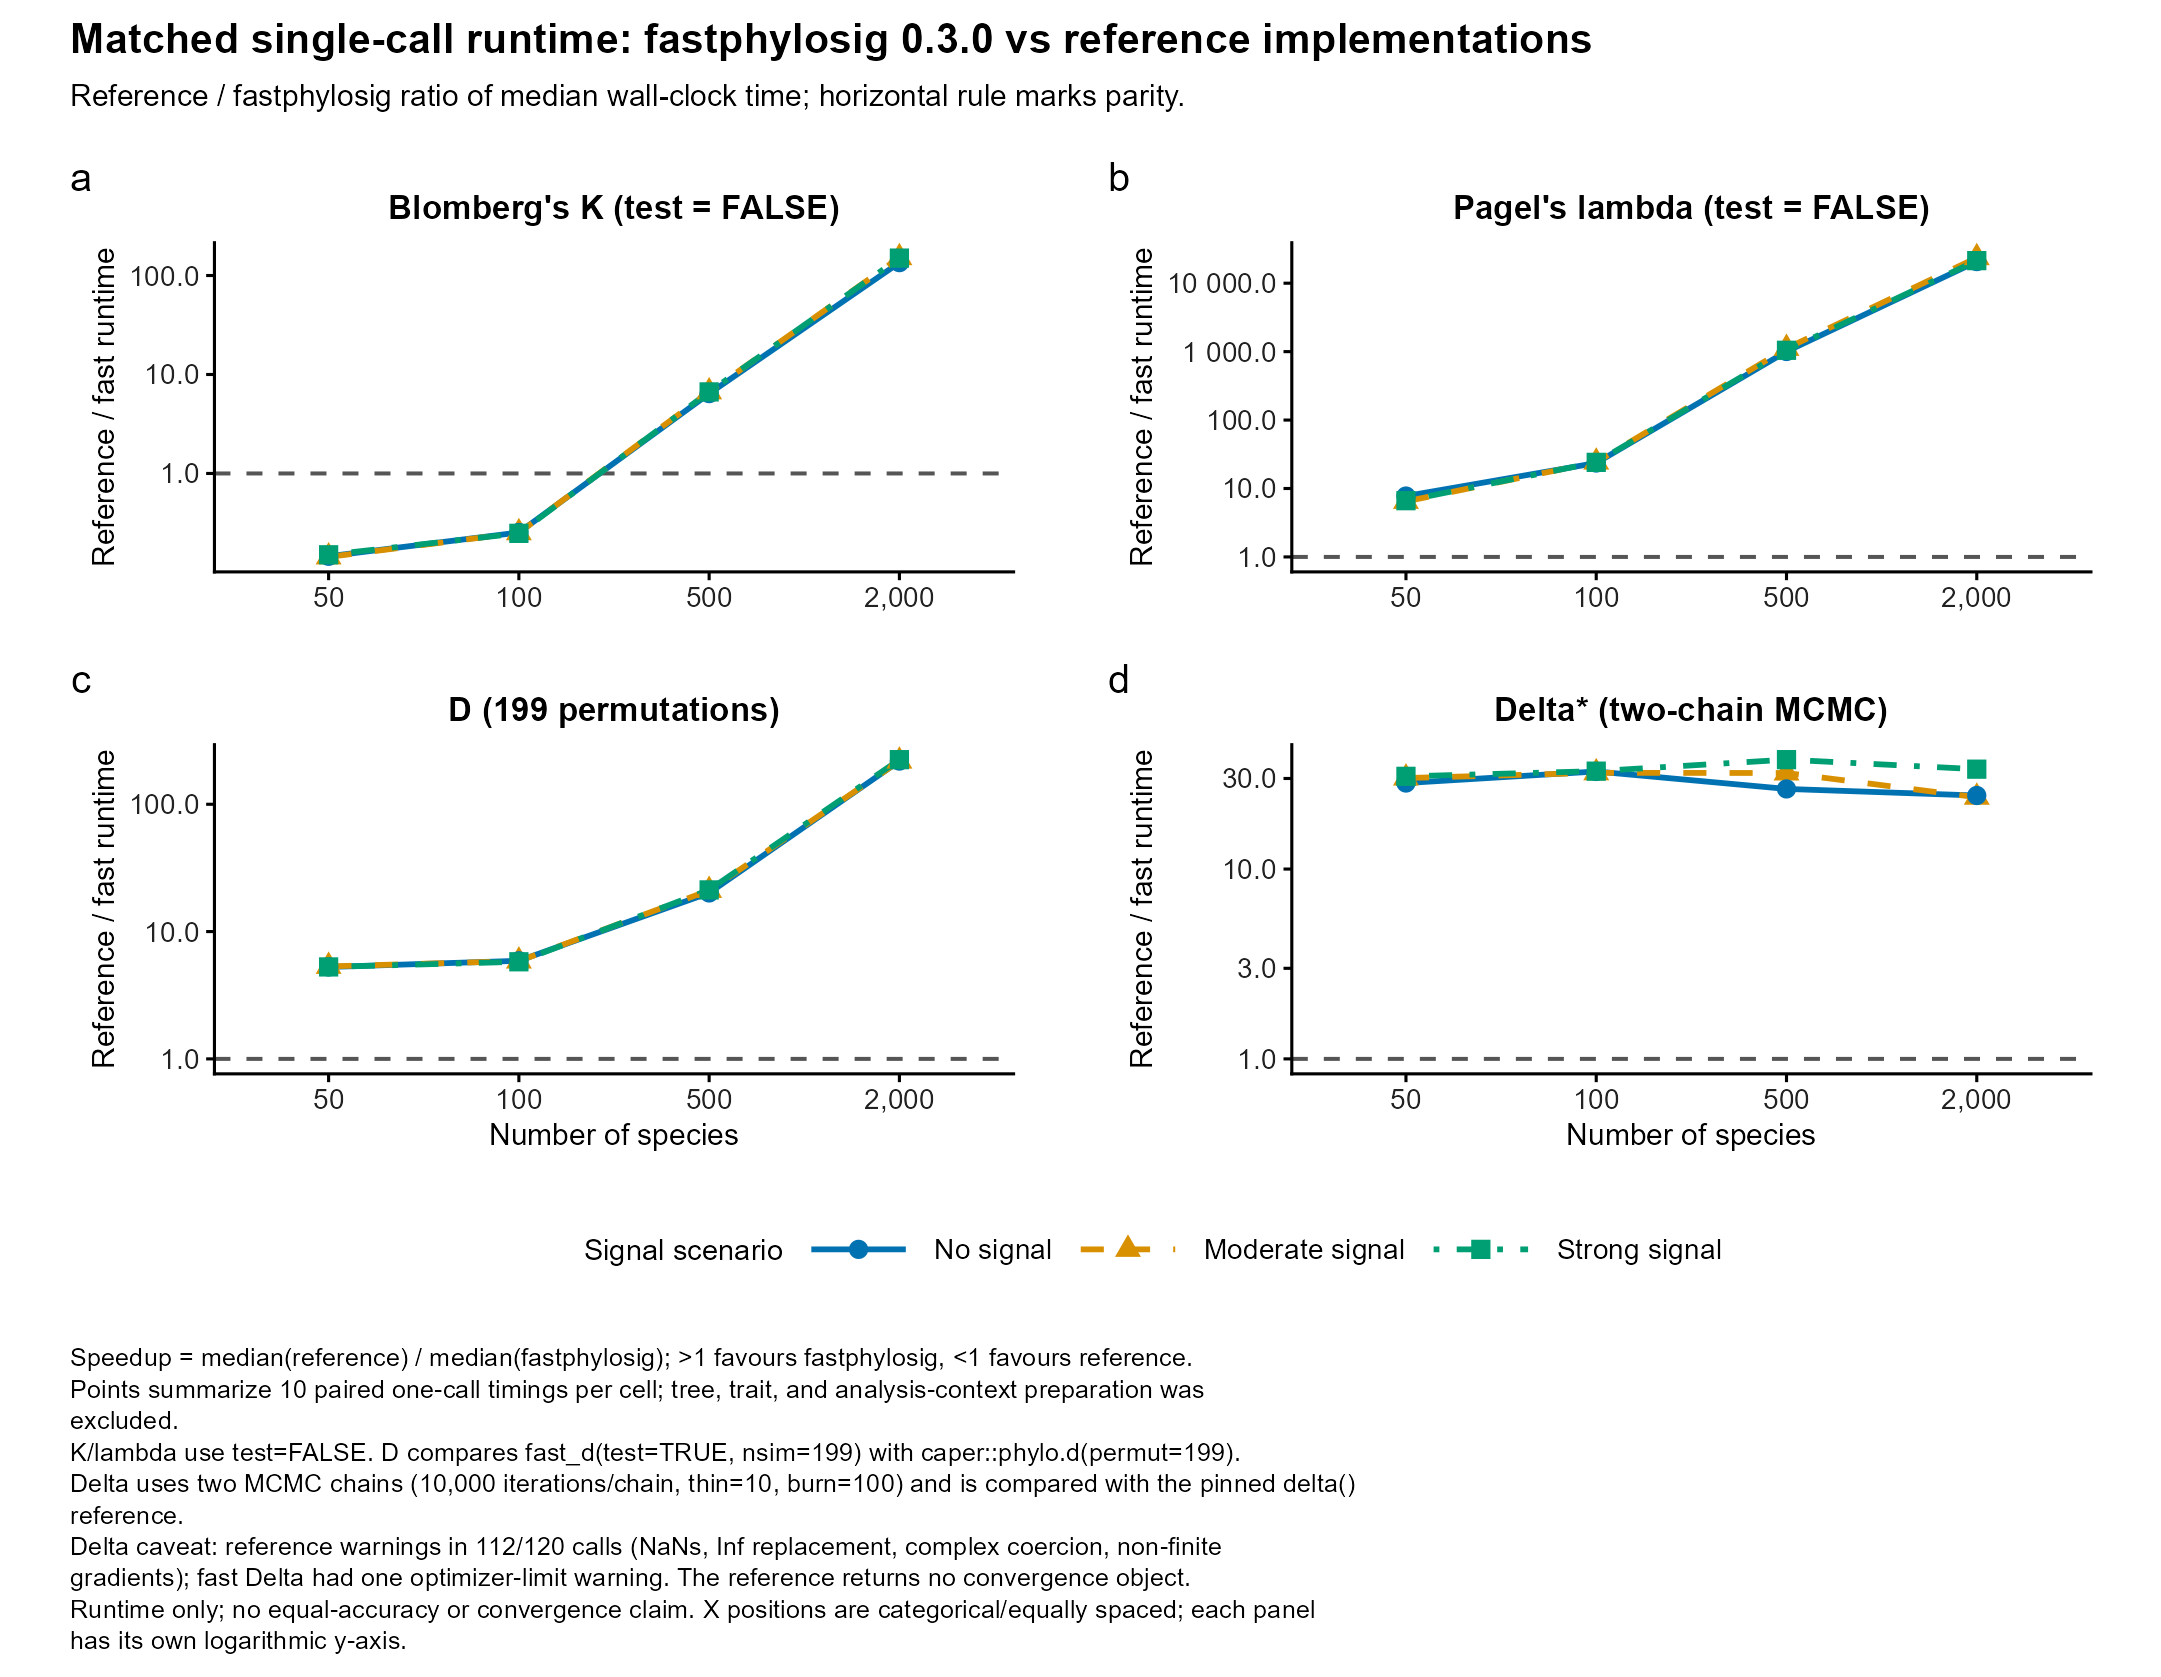
The four-panel figure combines the completed 0.3.0 K/lambda run with the completed D/Delta run: 480 matched pairs and 960 timed calls. No historical 0.1.0 or 0.2.0 timings are relabelled as 0.3.0.
| Species | K ratio | Lambda ratio | D ratio | Delta call-time ratio* |
|---|---|---|---|---|
| 50 | 0.143–0.151 | 6.48–7.76 | 5.27–5.33 | 28.39–30.78 |
| 100 | 0.248–0.253 | 23.57–24.28 | 5.79–5.90 | 32.13–32.79 |
| 500 | 6.41–6.67 | 1,004–1,115 | 20.11–21.24 | 26.43–37.69 |
| 2,000 | 134.91–151.40 | 20,697–23,591 | 218.20–224.09 | 23.89–33.58 |
Ratios are reference median divided by fast median. Ranges span the three
designed signal scenarios, not confidence intervals. References: phytools
2.5.2 for K/lambda, caper for D, and pinned Borges 2019 R code for Delta.
The workload differs by statistic: D includes 199 random/Brownian simulations
on both sides; Delta includes two 10,000-iteration chains (thin = 10,
burn = 100, lambda0 = 0.1, proposal_sd = 0.5, LSE entropy, ARD model),
without permutation testing. Context and caper comparative-data construction
are outside timing. D and Delta use discretized versions of the same simulated
continuous mixtures: median threshold for D and three rank-based classes for Delta.
Delta diagnostic limitation: 112/120 reference calls emitted numerical warnings (NaNs, replacement of Inf, complex-to-real coercion or non-finite gradients). All returned a finite Delta, but the reference wrapper exposes only that number, not final ancestral-state fit convergence. One fast call reached its transition-rate optimization iteration limit. No warned call was removed or rerun. Thus Delta ratios are observed returned-call timings; they do not establish equal accuracy, effective sampling or valid convergence.
The D/Delta full script completed all timed calls but exited with a post-processing call-order-field error. Its original raw records were preserved; derived pairs/summaries were reconstructed and audited without repeating calls. Recovery provenance and warnings are disclosed in the QA.
- Four-panel plotting code and QA/diagnostic report
- D/Delta timed calls, pairs, cell summaries, metadata, and benchmark script
- D/Delta diagnostics and recovery audit, raw-record post-processing script, and clean four-panel source data
To reproduce D/Delta, additionally obtain the external Borges comparator
from its recorded upstream source
and place the byte-identical file at paper/reference_sources/delta_borges2019_code.R
in a separate working checkout. Required SHA-256:
0dc1e987c13f0e972b0e7c3b4829b4d0fdc41ff0de3856bae4803f9ce0115175.
The benchmark refuses a different file; upstream content may change. This
third-party comparator is not redistributed as part of fastphylosig.
With the validated tarball environment variable and isolated release library
described below, run Rscript --vanilla docs/release-0.3.0/benchmark_reference_d_delta.R --profile full --library <isolated-library>.
Use a separate checkout without existing result files; do not overwrite the
published evidence. Full comparison includes lengthy reference calls.
K/lambda timing contract
The direct reference comparison uses the public fast_k() and fast_lambda() calls from 0.3.0 against phytools::phylosig() on identical complete tree/trait inputs. Fast functions receive a preconstructed single-column matrix, while phytools receives the equivalent named vector; values and species order are identical. The matrix output exposes actual retained/matched species counts for auditing. Tree generation, trait generation, matching, matrix construction, and fastphylosig context preparation occur before timing. Both implementations use test = FALSE: this measures K point estimation and lambda likelihood fitting, not permutation-test throughput.
The completed matrix has 50, 100, 500 and 2,000 tips; simulated Brownian/noise mixtures with weights 0, 0.5 and 0.95; and 10 paired tree/trait replicates per cell: 240 pairs and 480 timed calls. These are designed signal scenarios, not guarantees that every simulated trait attains a particular realized signal value. Speed ratio means reference elapsed time divided by fastphylosig elapsed time. Ratios below 1 are displayed as slower, not omitted.
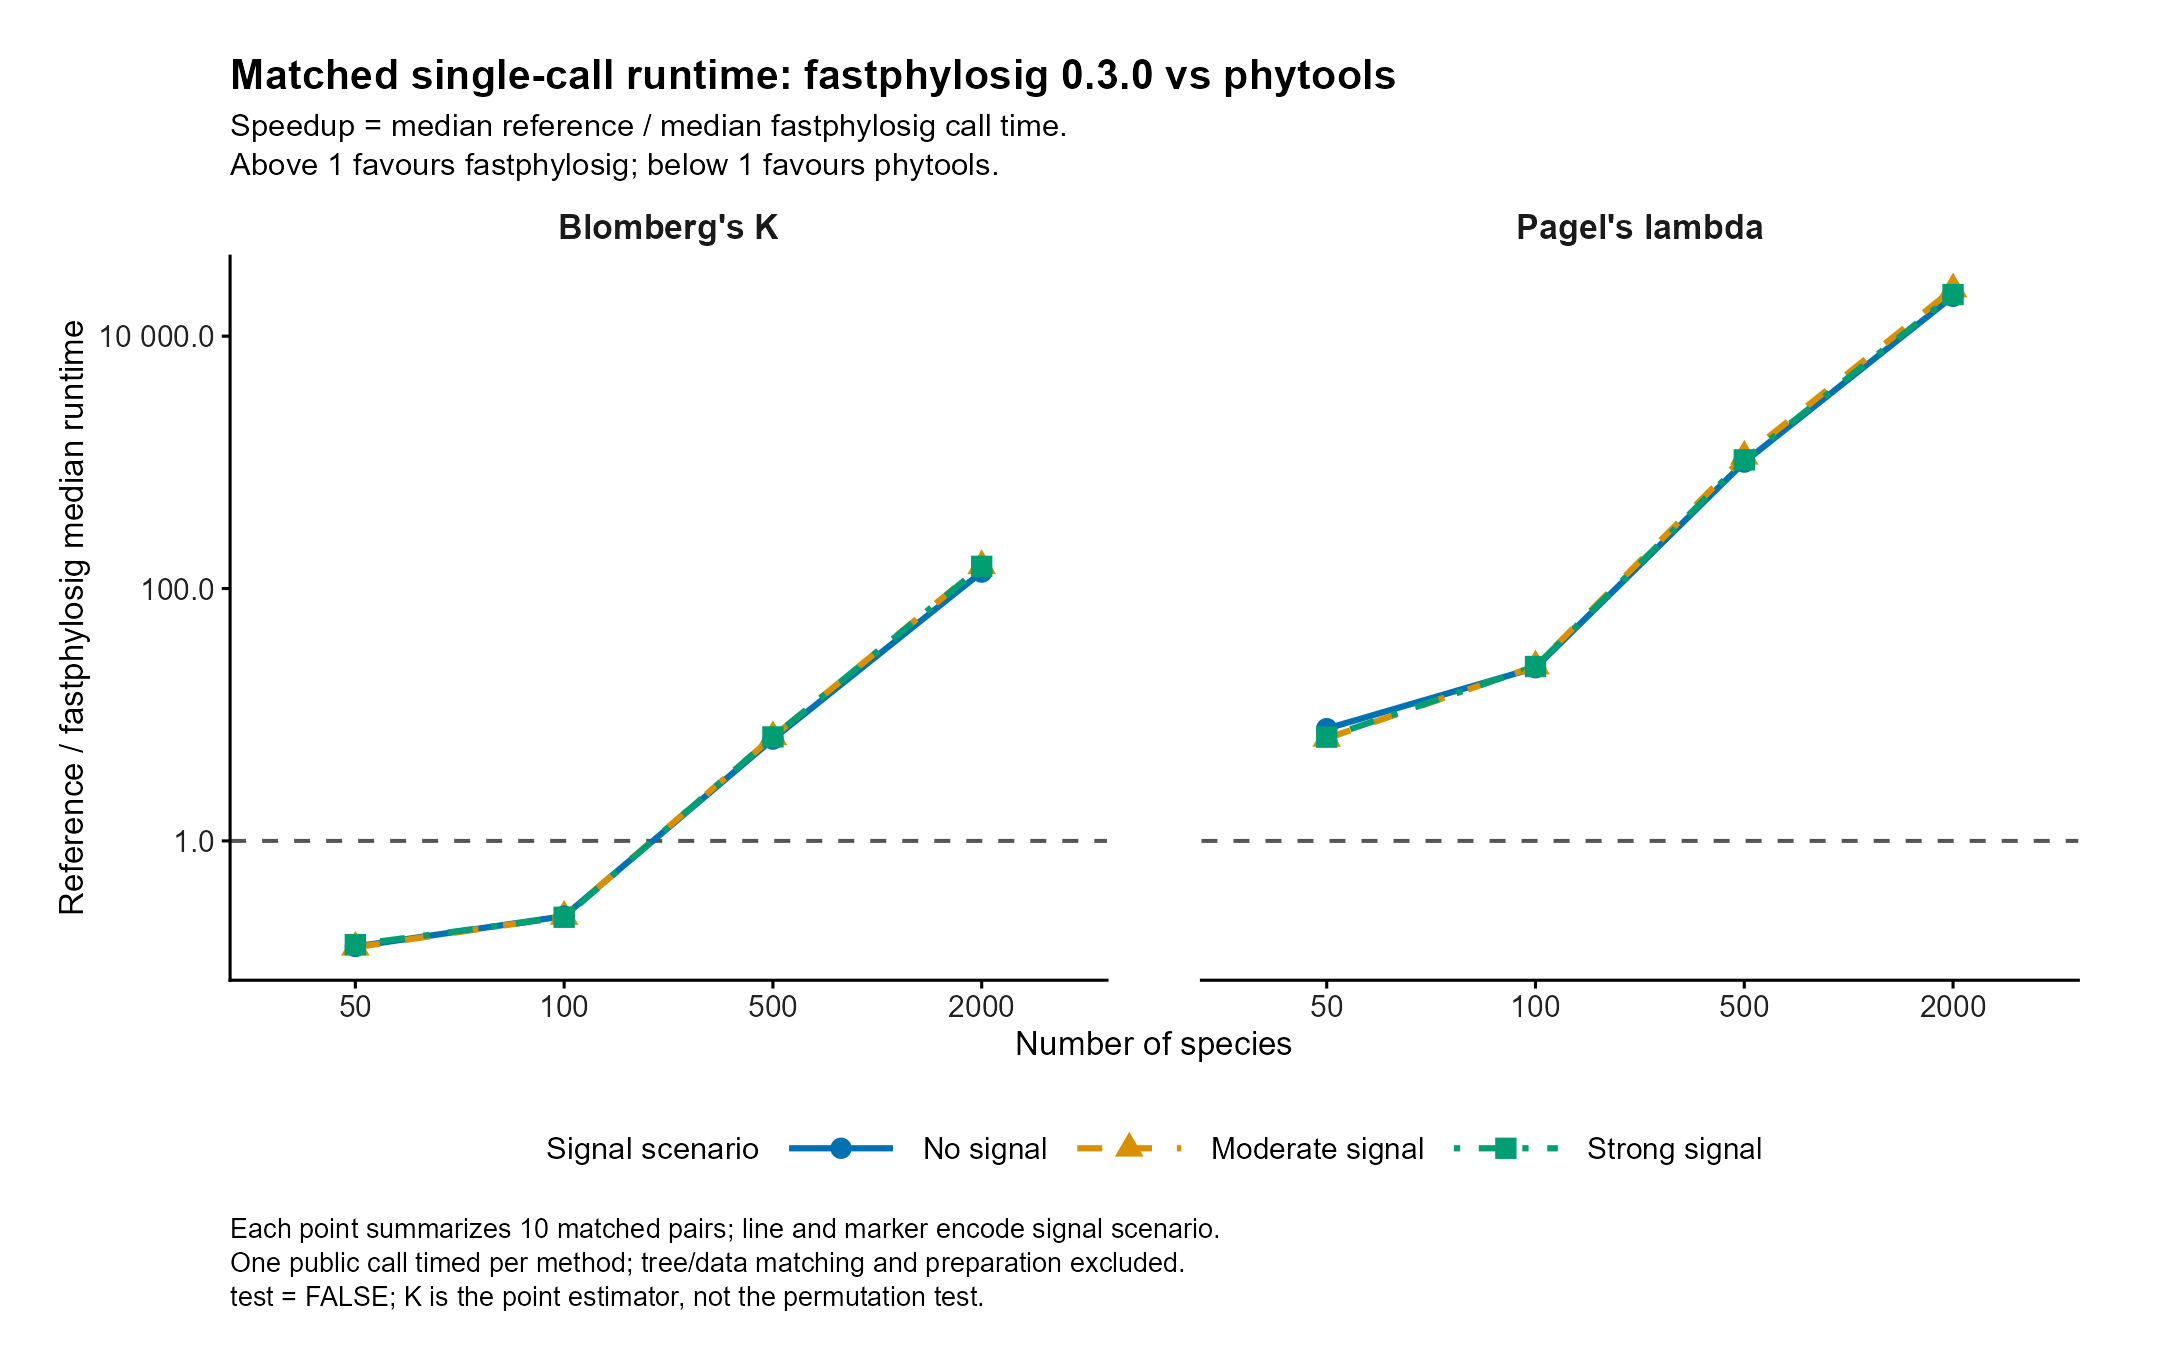
| Species | K reference / fast median time | Lambda reference / fast median time |
|---|---|---|
| 50 | 0.143–0.151 | 6.48–7.76 |
| 100 | 0.248–0.253 | 23.57–24.28 |
| 500 | 6.41–6.67 | 1,004–1,115 |
| 2,000 | 134.91–151.40 | 20,697–23,591 |
Ranges span the three designed signal scenarios, not confidence intervals. The largest ratio for both metrics occurred in the moderate scenario at 2,000 species: K, 3.188 s versus 0.02106 s (151.40); lambda, 626.694 s versus 0.02656 s (23,591.44). K is slower than reference at 50 and 100 species. The unusually large lambda ratio should be read with its absolute call times and the recorded reference/R versions; it is not a claim about every implementation, hardware platform or workload.
Data and reproduction
- Cell summaries, matched pairs, individual timed calls, and version/hash/timing metadata.
- Benchmark R script, plotting R script, and figure QA.
- Download the validated source tarball from the v0.3.0 release, verify SHA-256
909b7ad27485dcc2d96a7bb1fc70b65b54e93245d75761aca406b9c52f06cbff, and install it into an isolated library. The default installed package is not used by the benchmark. - In a separate checkout with an empty output directory (the scripts refuse to overwrite existing results), set
FASTPHYLOSIG_SOURCE_TARBALLto that downloaded file. Run from the repository root:Rscript --vanilla docs/release-0.3.0/benchmark_reference.R --library <isolated-library>, thenRscript --vanilla docs/release-0.3.0/plot_benchmark_reference.R. Install the dependencies listed in those scripts into an available R library first.
One untimed pair warms up each metric/size before formal timing. Call order alternates, giving five fast-first and five reference-first pairs per cell. Every timer contains one public call; garbage collection and seed assignment are outside the timer. The run was performed on Windows using R 4.6.1 and phytools 2.5.2. Sub-millisecond small-tree reference K calls can be sensitive to timer resolution; these results are descriptive rather than significance tests. The summary also reports quartiles and paired ratios separately; those paired-ratio summaries are not substituted for the plotted ratio of medians.
Independent 0.3.0-versus-0.2.0 permutation K performance evidence has a different workload and baseline and must not be multiplied into reference ratios. Timing results are descriptive and hardware-specific, not universal speed guarantees.
Plotting examples
Examples use the actual plot_signal() implementation on reproducibly simulated demonstration data. They illustrate the output styles and are not empirical ecological findings or scientific validation of short example MCMC runs.
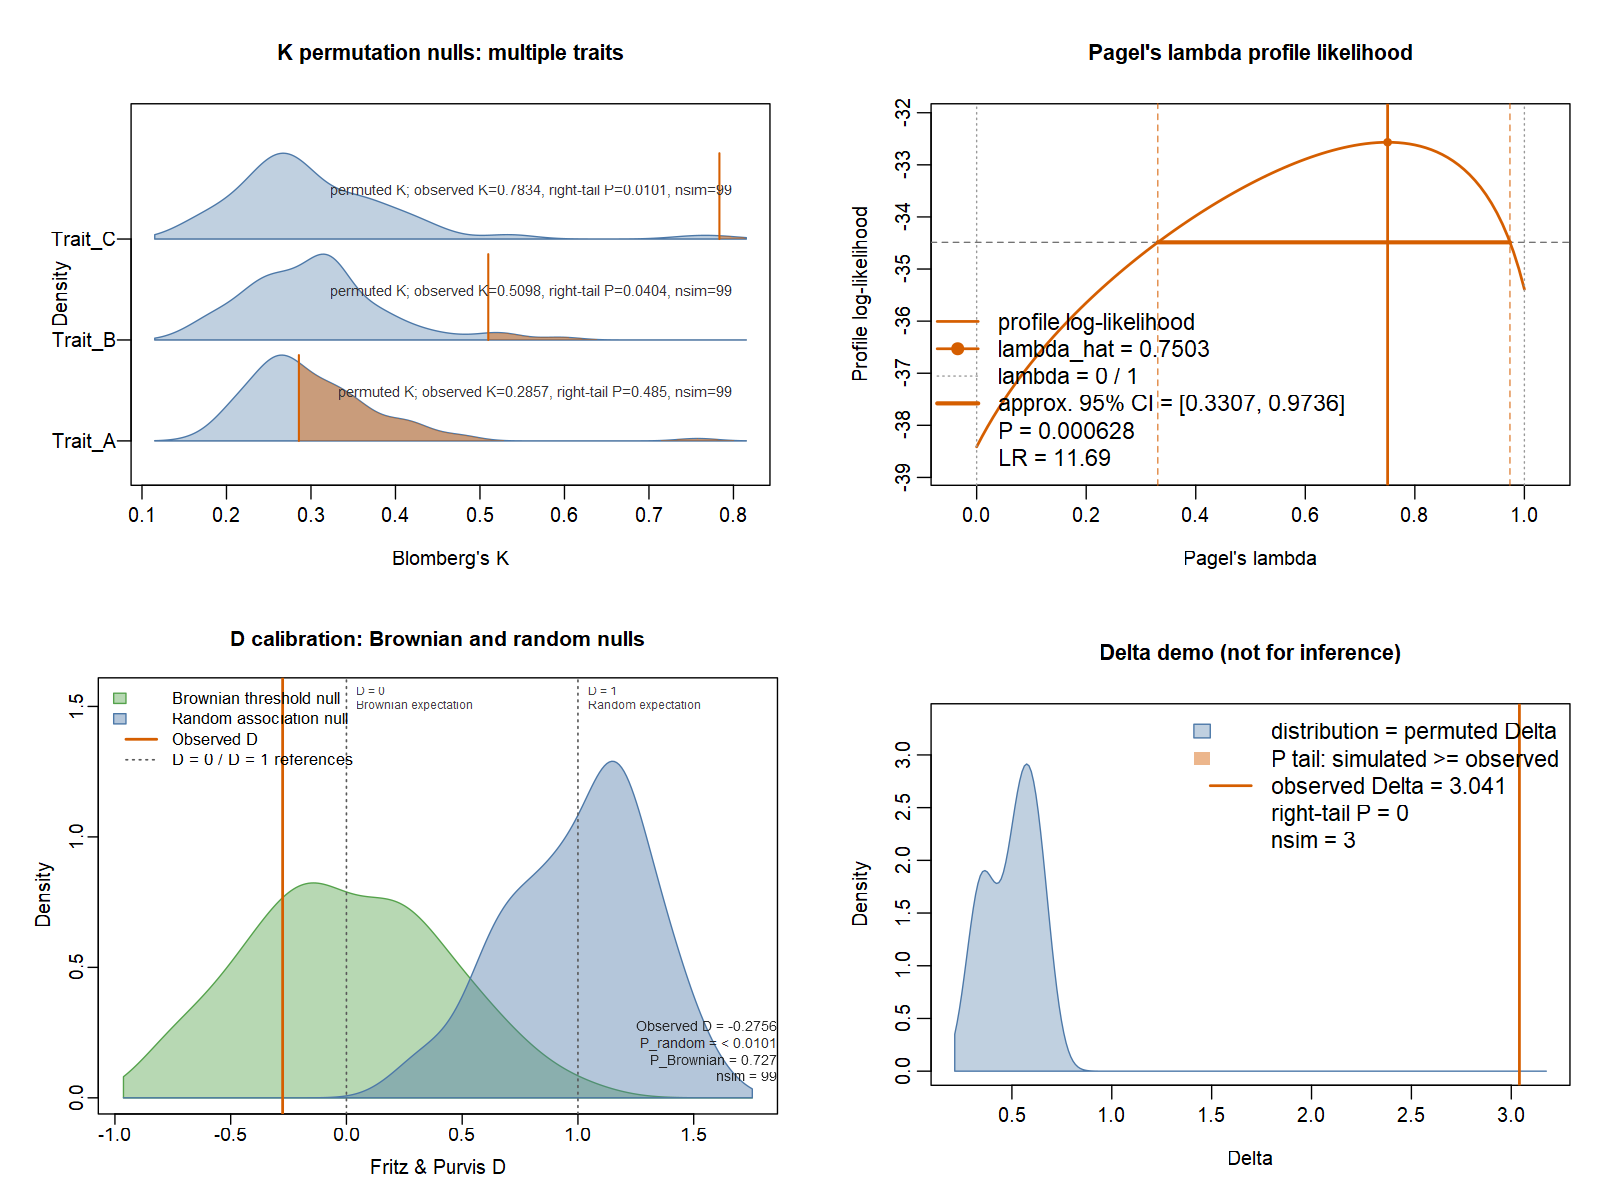
The six-style gallery includes single-trait K, multi-trait K ridges, lambda profile likelihood, D random/Brownian calibration, separate D null displays, and categorical Delta permutation output. The R script recreates the data and all PNG/SVG/PDF exports using version 0.3.0.
The tree has 32 tips; K and D use 99 simulations. Lambda uses 101 profile points. Delta deliberately uses only 3 permutations and a short MCMC chain (mcmc_sim = 60, thin = 10, burn = 20); its ESS and split-Rhat warning is recorded in the gallery report. The Delta panel is explicitly not for inference, including its displayed Monte Carlo P value.
k <- fast_k(tree, x, test = TRUE, nsim = 999,
            return_sim = TRUE, progress = FALSE)
plot_signal(k)

lambda <- fast_lambda(tree, x, test = TRUE,
                      lambda_profile = TRUE, progress = FALSE)
plot_signal(lambda)

d <- fast_d(tree, binary_trait, test = TRUE, nsim = 999,
            return_sim = TRUE, keep_null = TRUE, progress = FALSE)
plot_signal(d)                    # both nulls on the D scale
plot_signal(d, null = "random")  # select one null
Use named vectors (or matrices with species row names) matched to the tree. K/Delta distribution plots require retained simulations; lambda profiles are deterministic likelihood summaries, not permutation nulls. D displays two distinct calibrations and corresponding P values.
Release boundaries
The 50K preparation mask-key limitation is deferred to 0.3.x. Release qualification is local Windows validation, not qualification on all platforms or CRAN acceptance.