plot_signal() gallery — fastphylosig 0.3.0
These are actual native plot_signal() outputs on simulated demonstration
data, not ecological findings. They show six display styles without changing
the released package implementation.
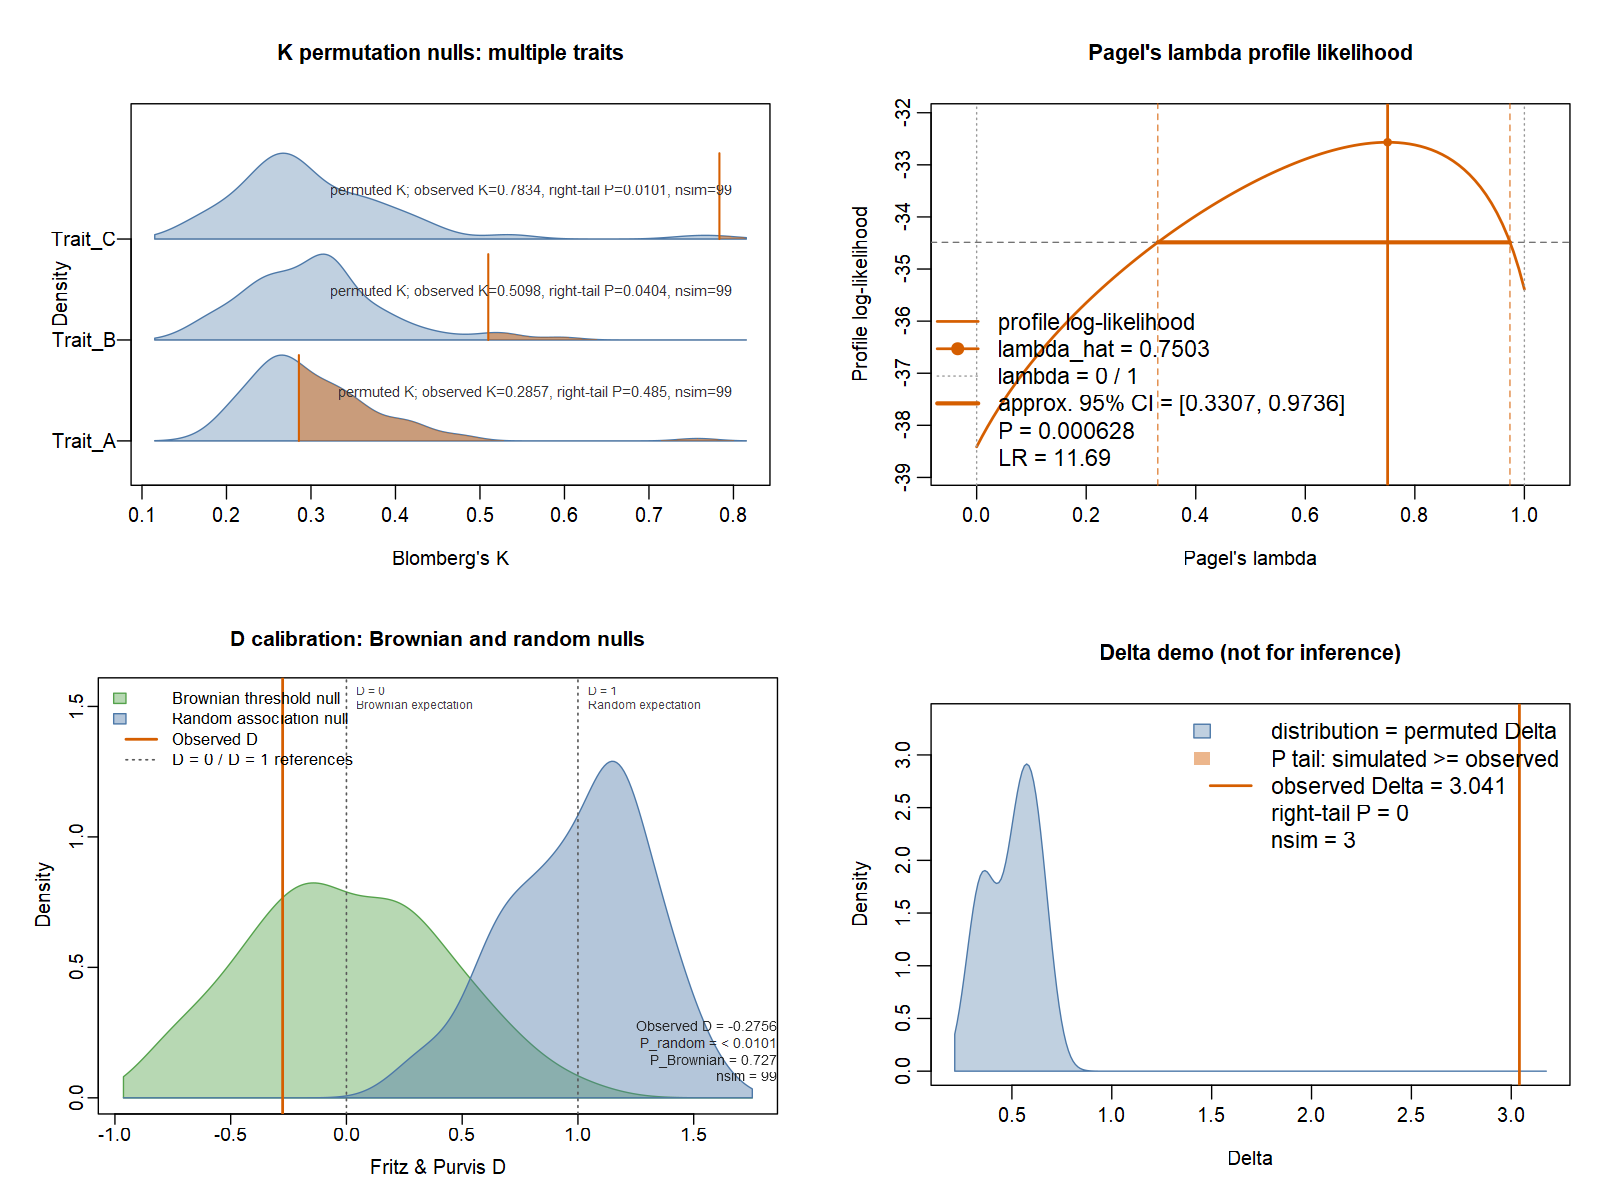
Single-trait K
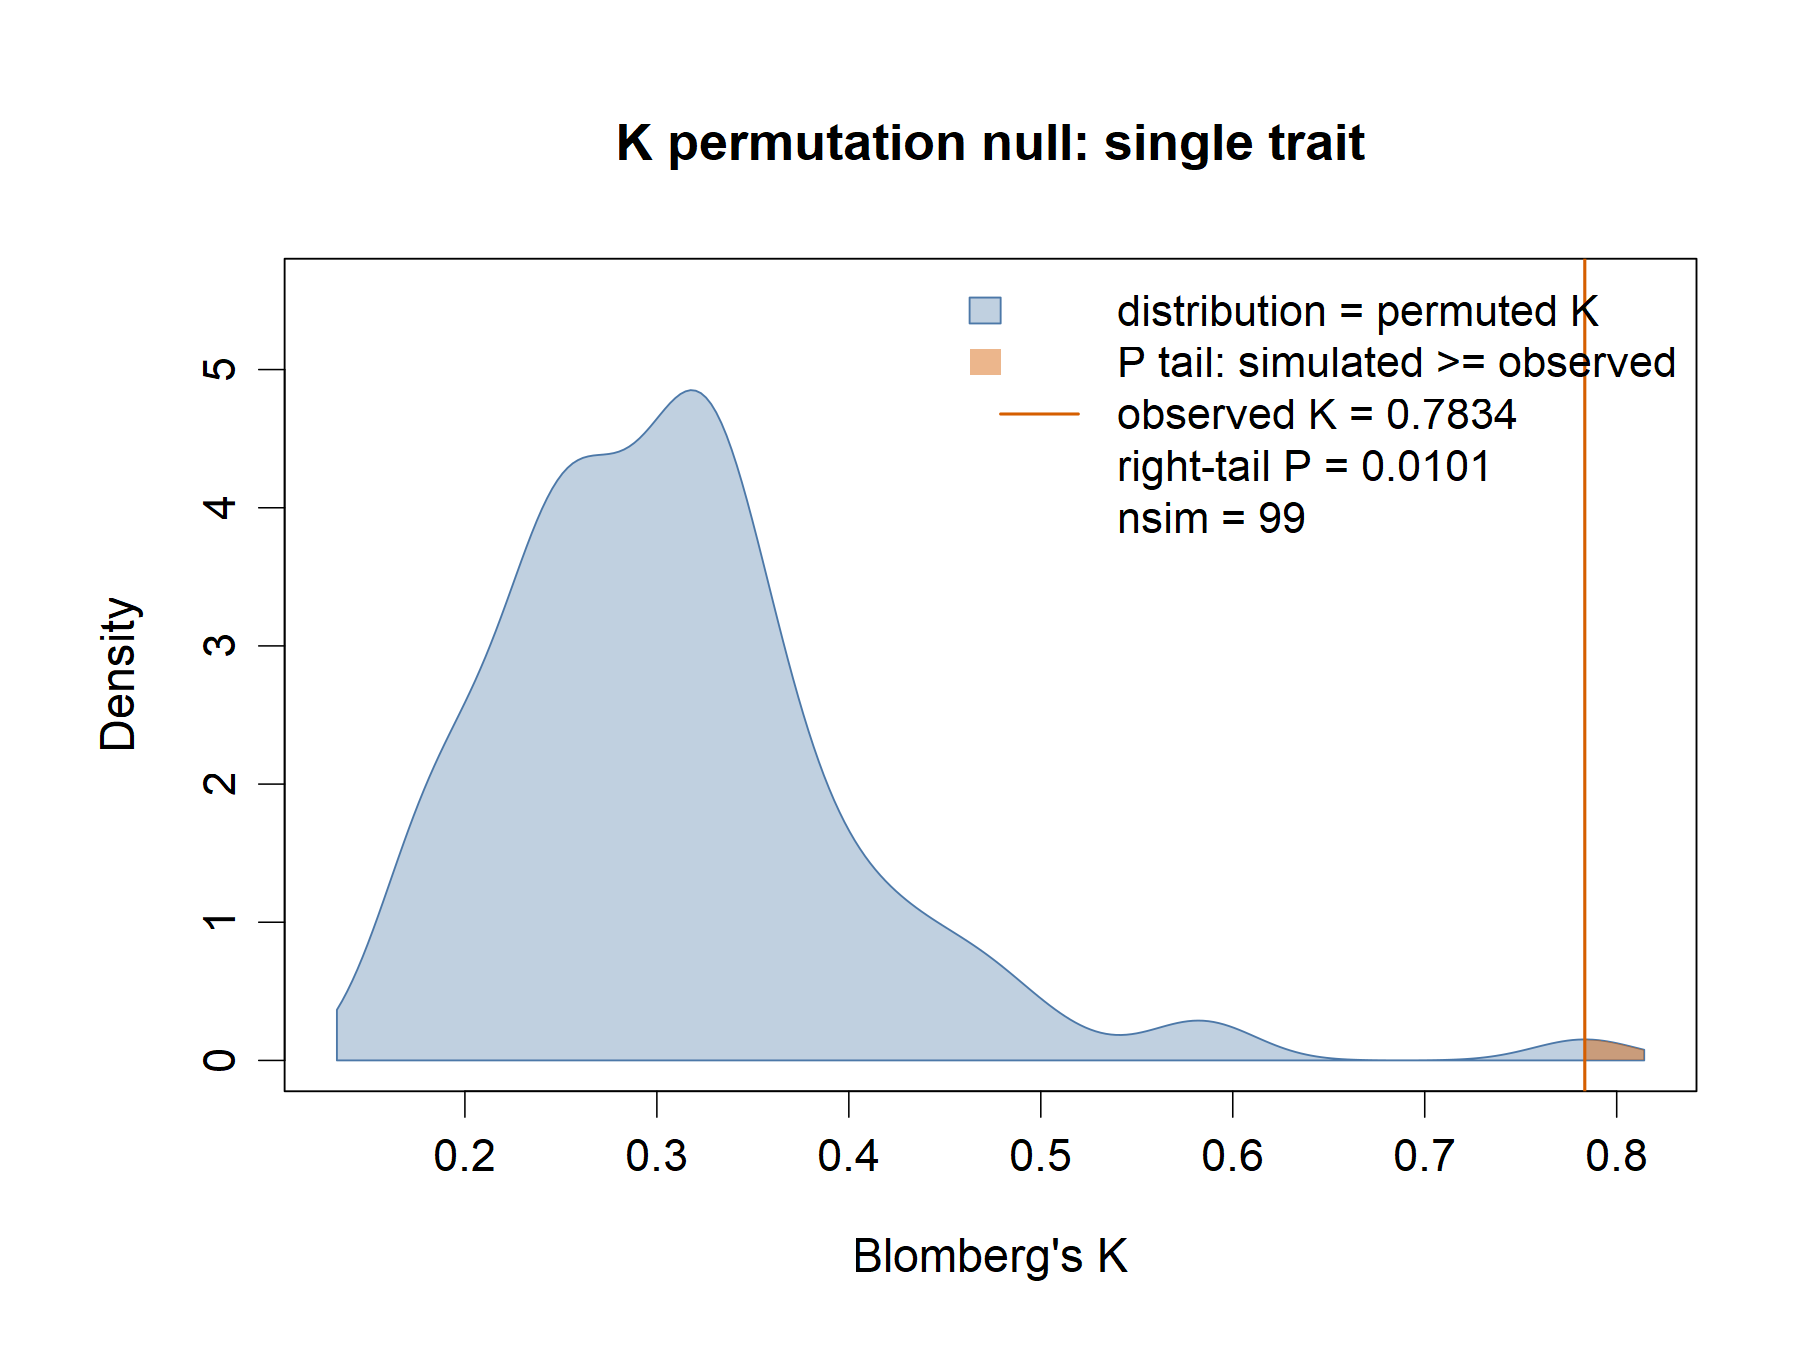
Multiple-trait K
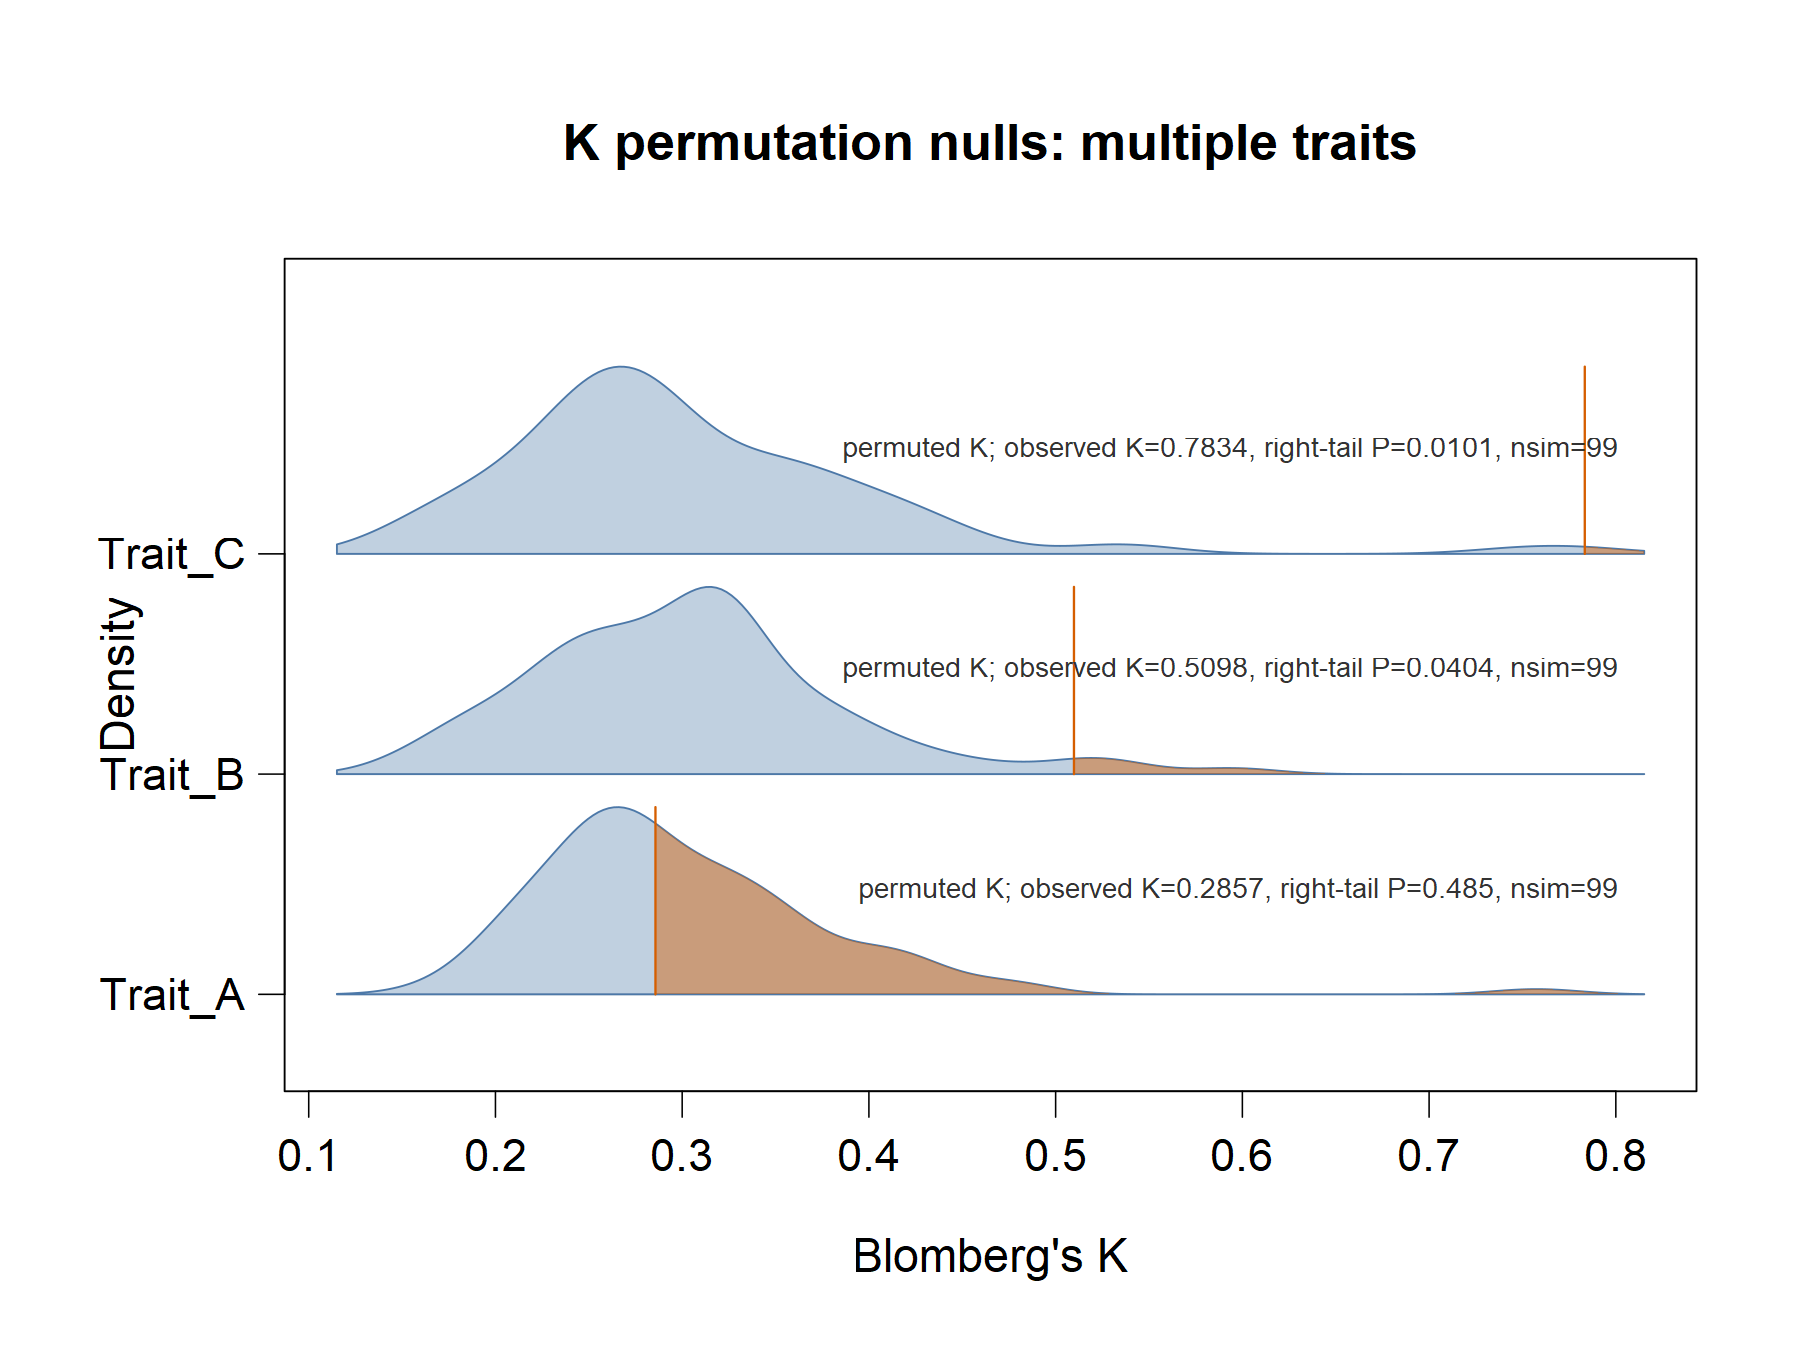
Lambda profile likelihood
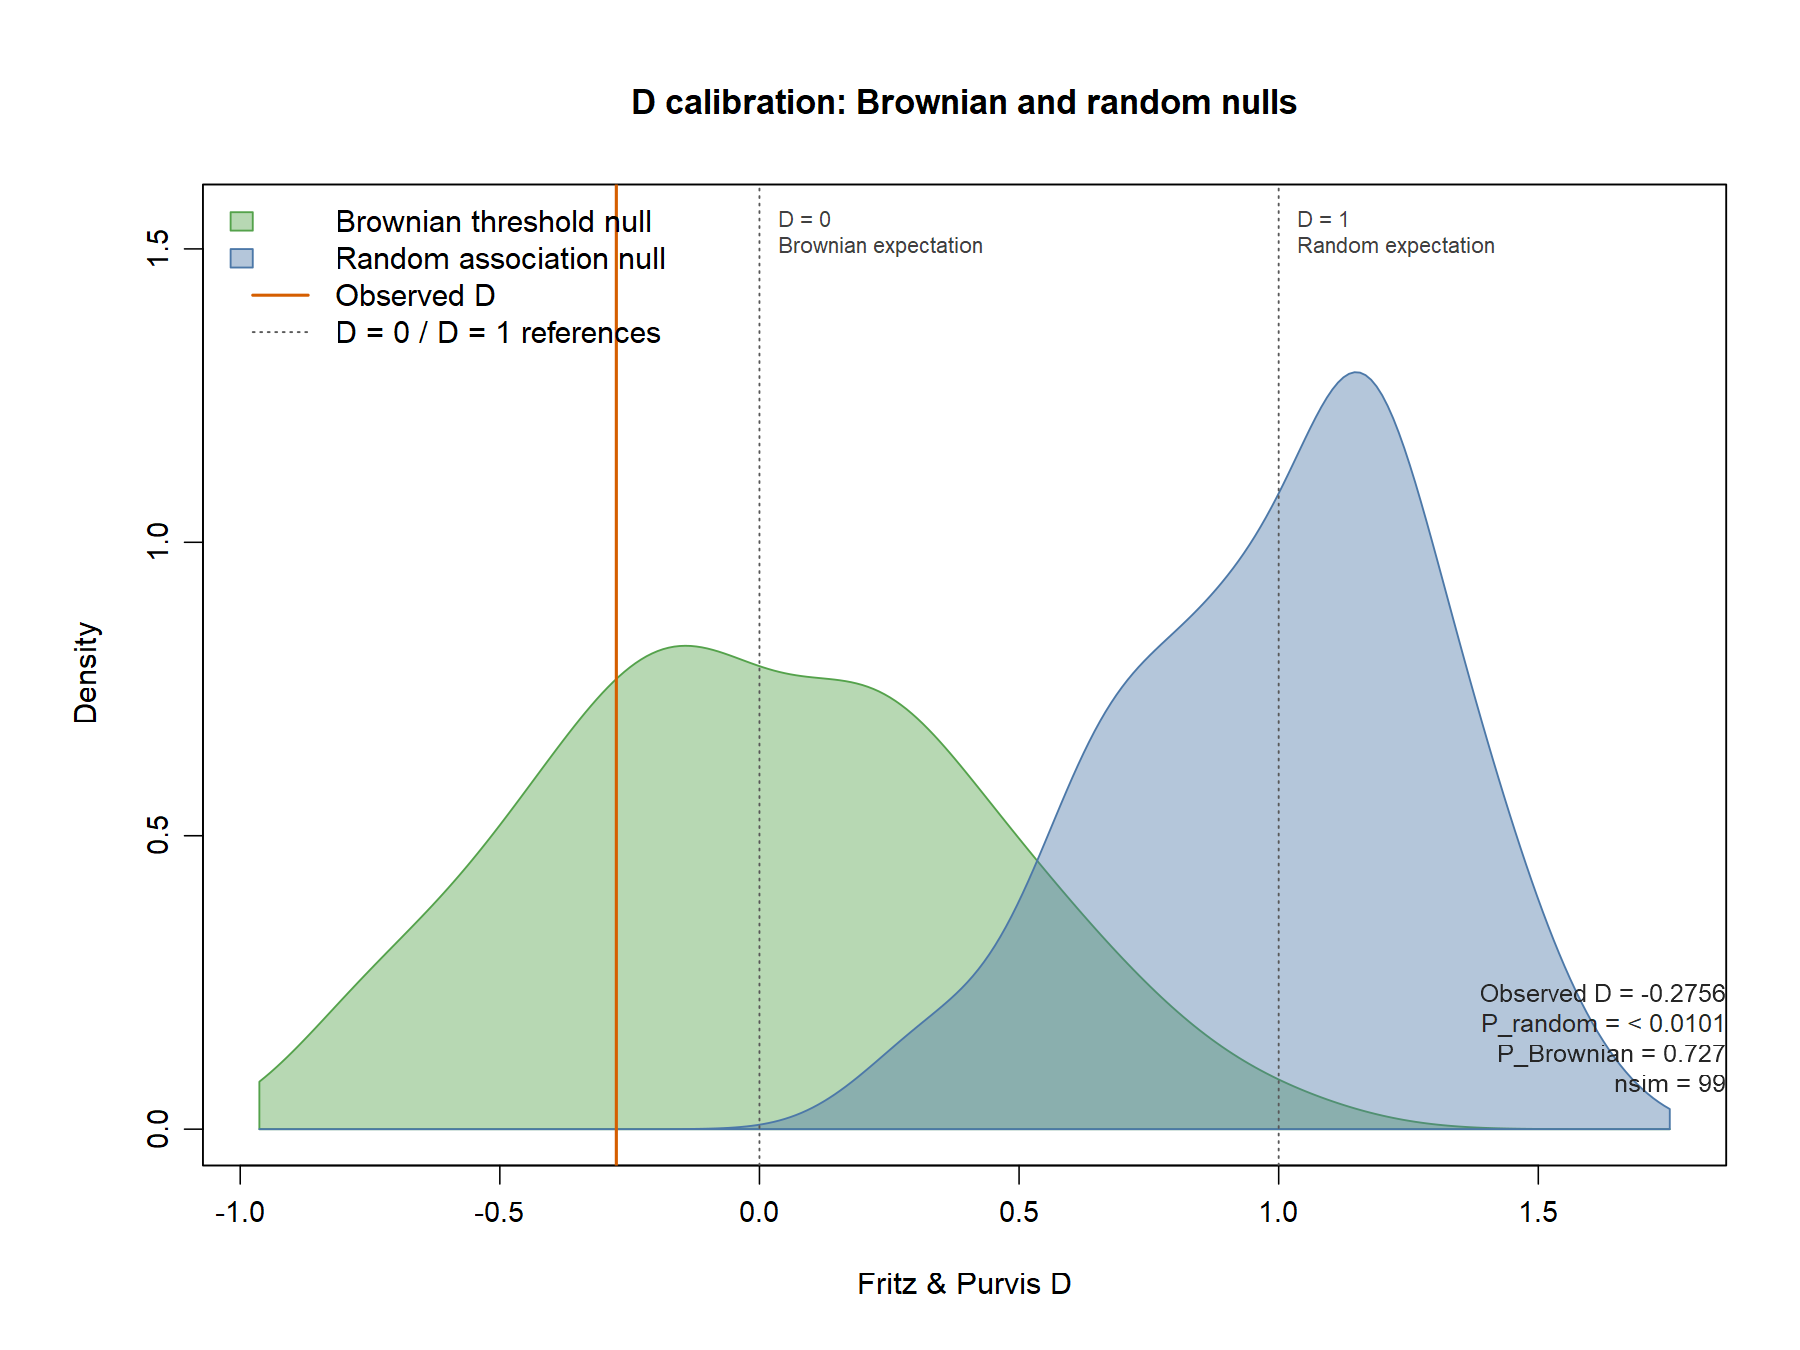
D: random and Brownian calibrations
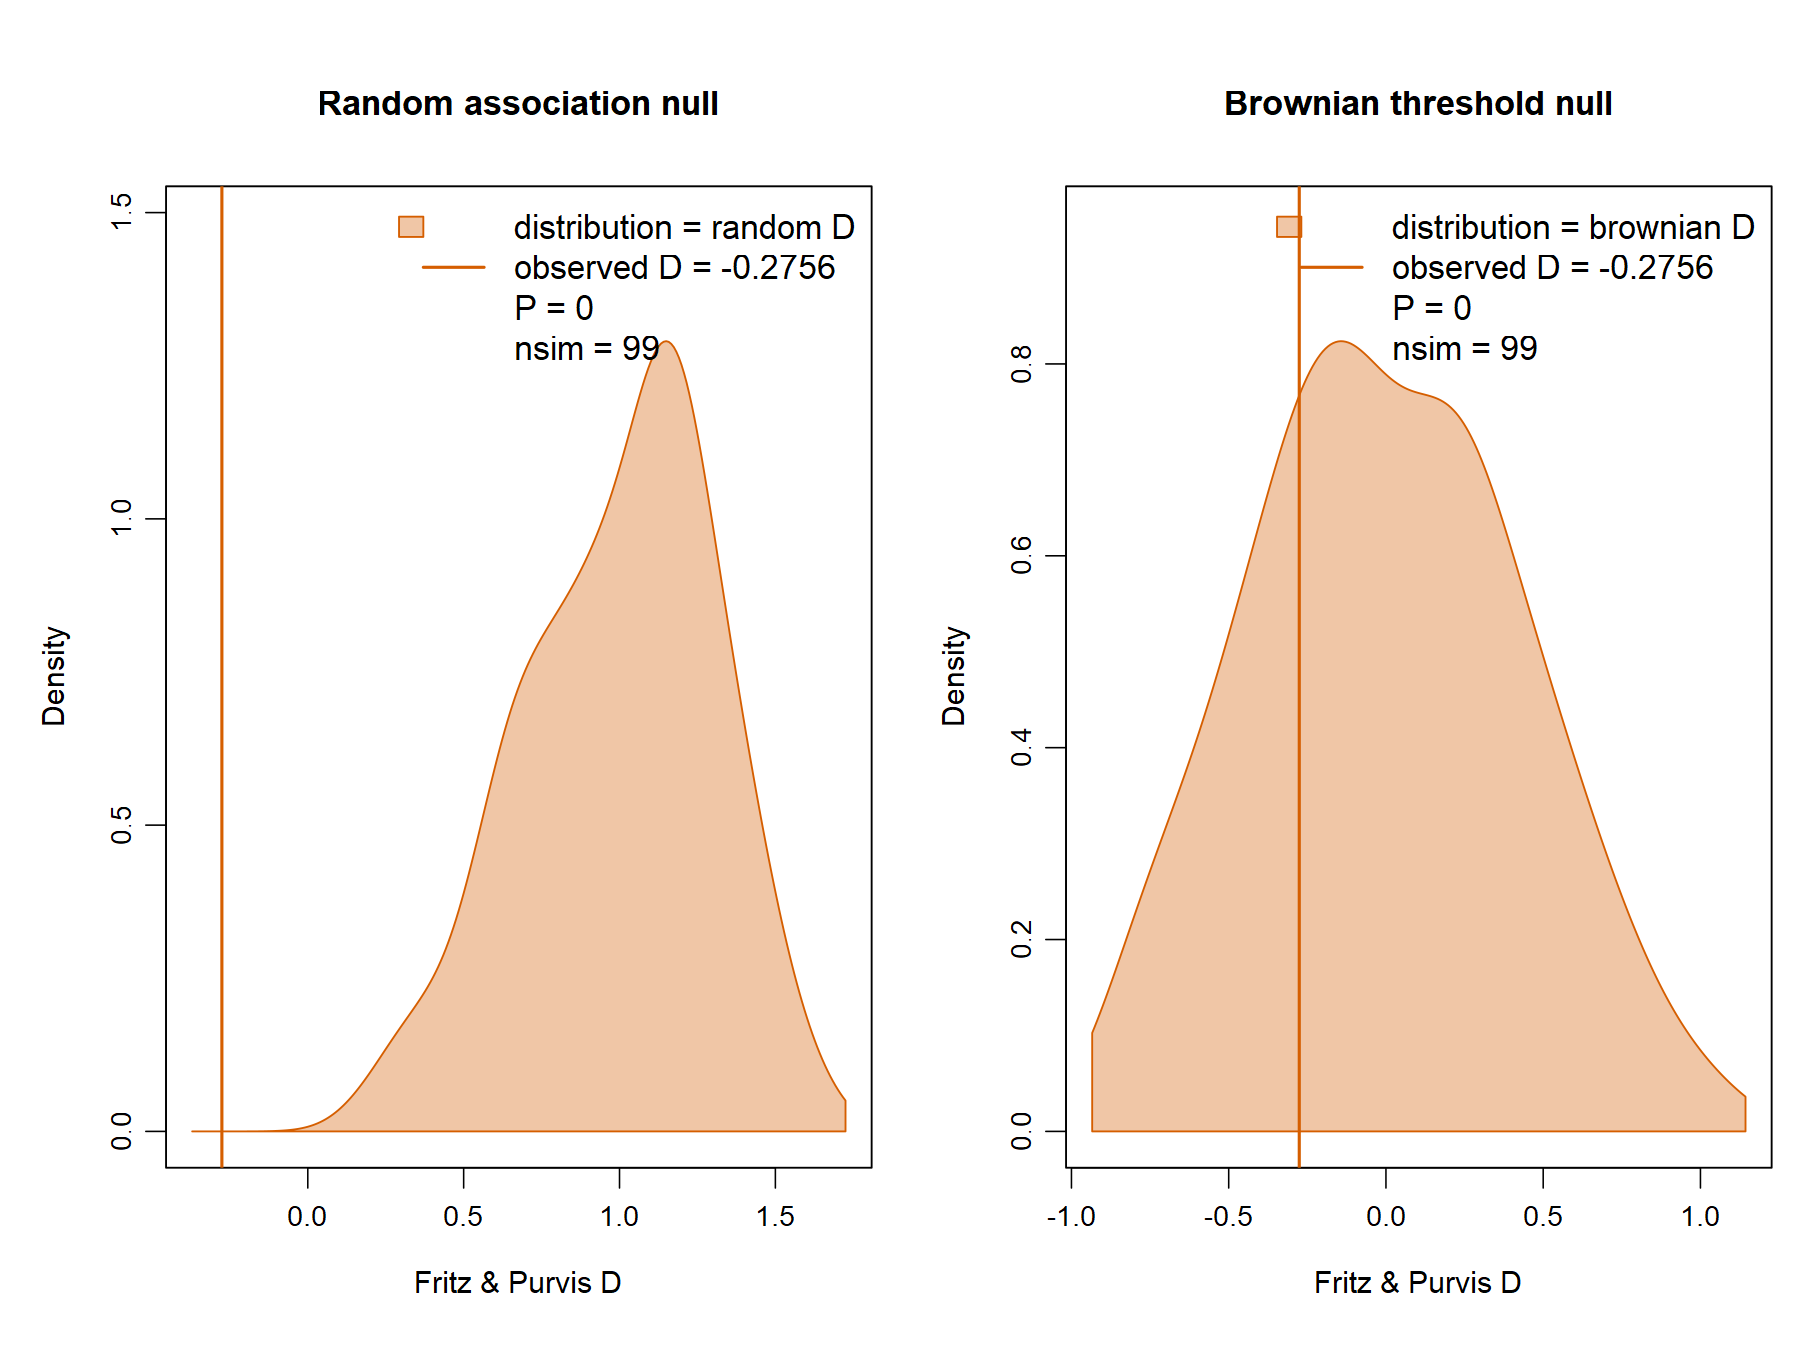
D: separate null displays
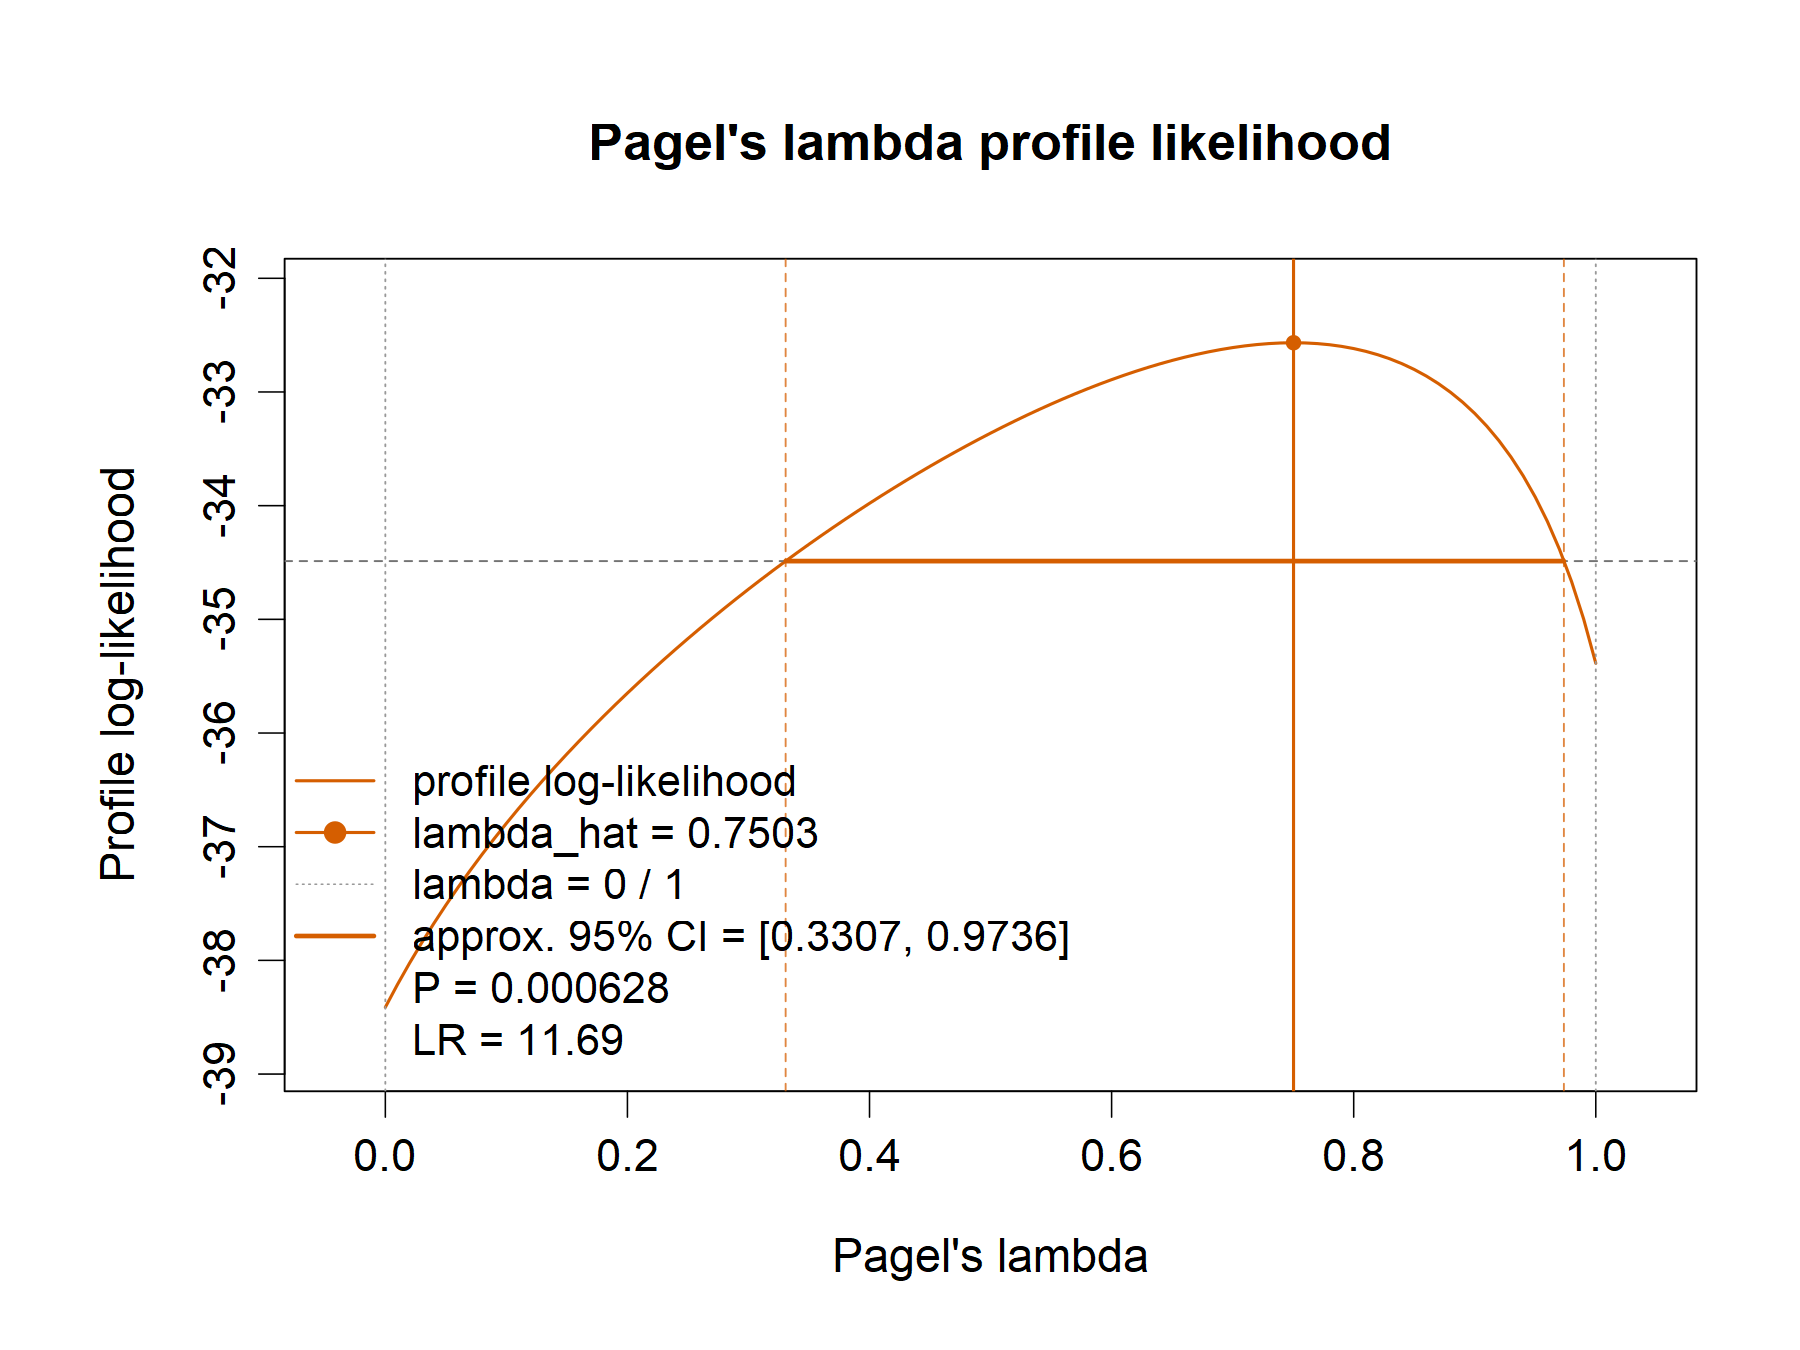
Categorical Delta
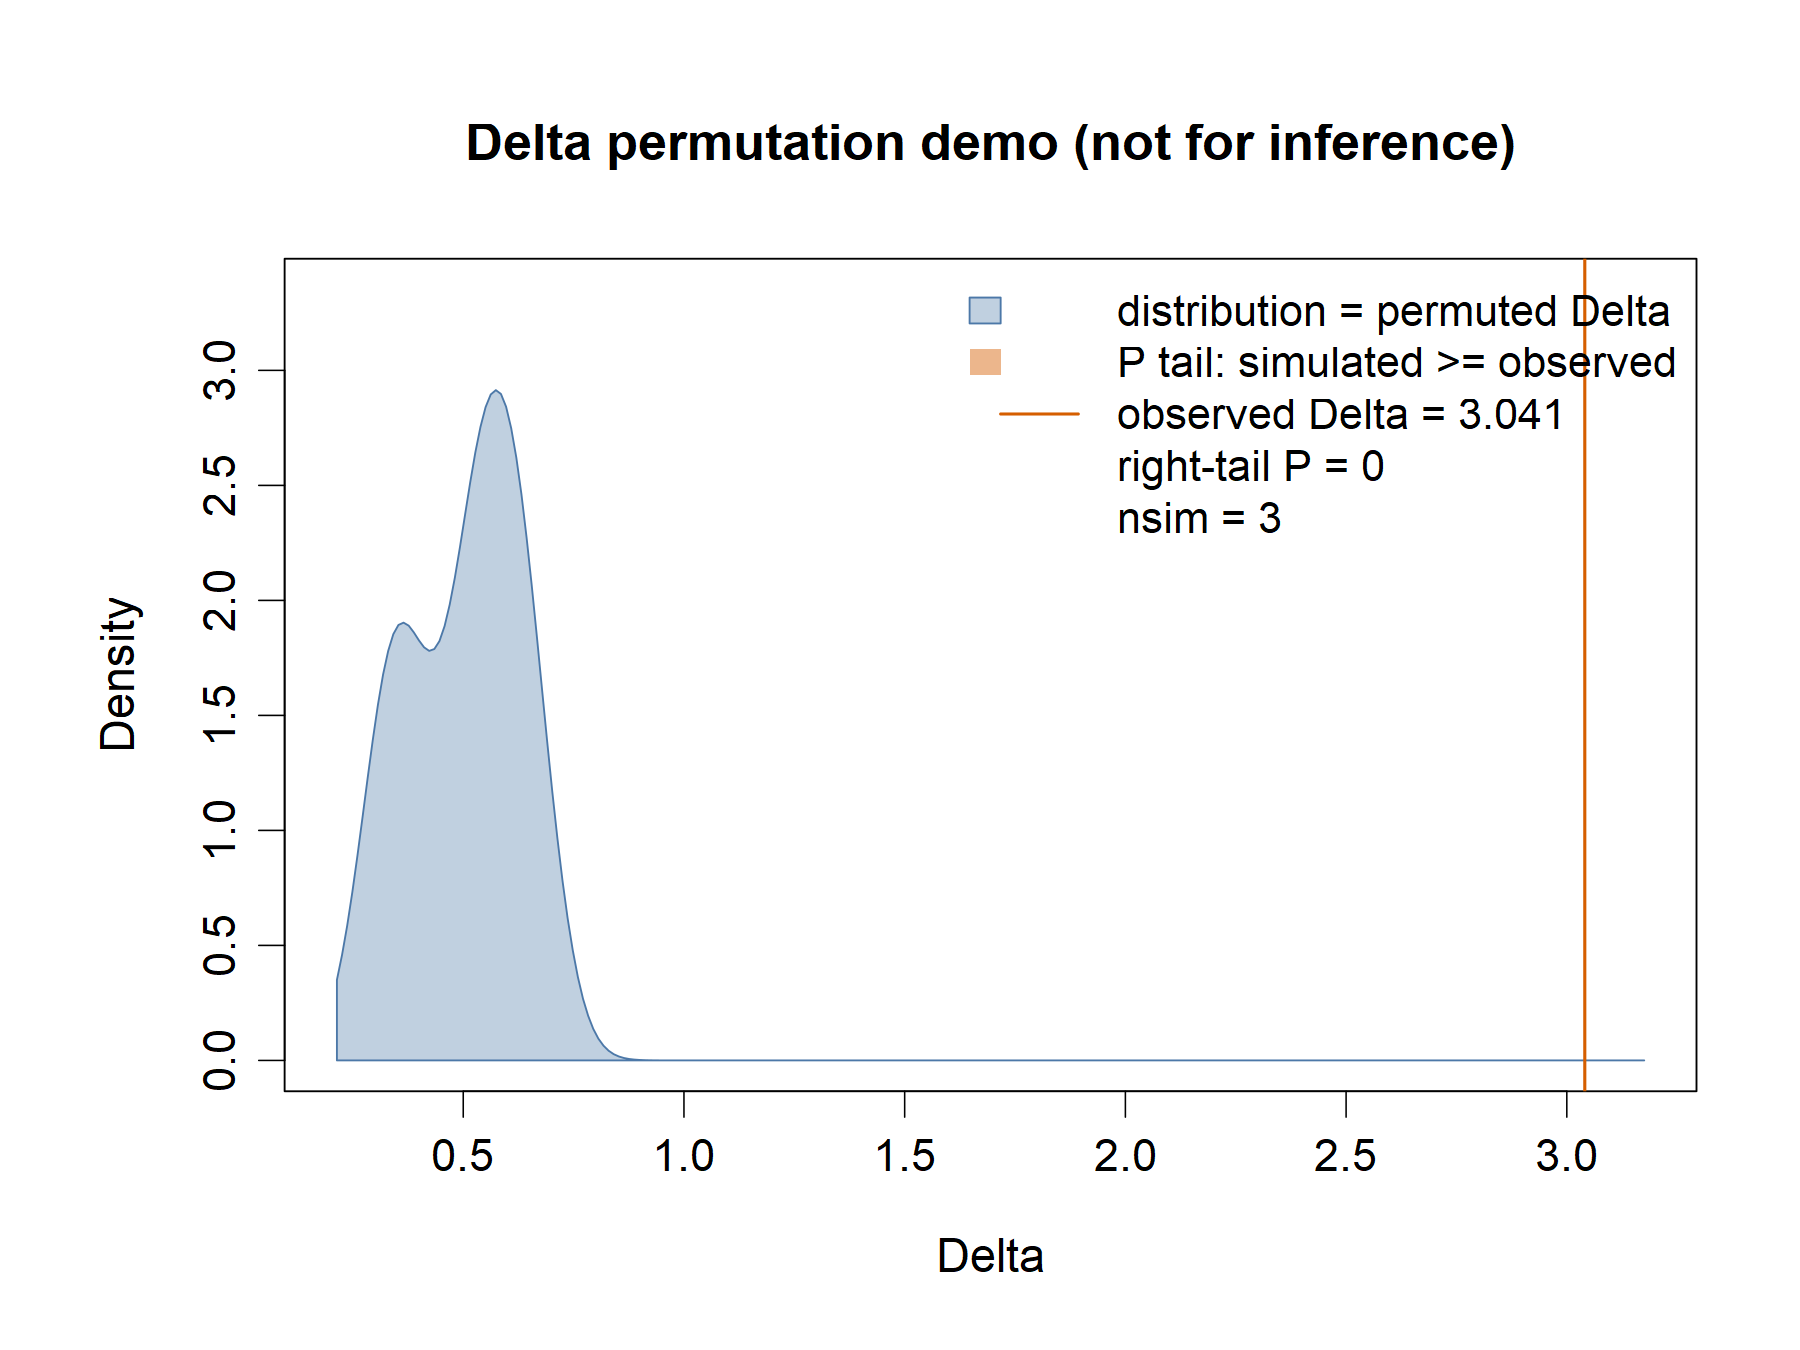
The Delta example uses only three permutations and a short MCMC chain; its ESS/split-Rhat warning is retained. Neither the estimate nor the displayed Monte Carlo P value should be used for scientific inference.
Settings, reproduction and limitations
The demonstration tree has 32 tips. Data seed: 20261001; K/lambda seed:
20261002; D seed: 20261003; Delta seed: 20261004. K and D use 99 simulations;
lambda uses 101 profile points. Delta uses mcmc_sim = 60, thin = 10,
burn = 20 and three permutations. No unsuccessful chain is rerun.
Use an isolated installation of the released 0.3.0 package as described in the script. PNG previews and editable SVG/PDF companions are provided here. Some native statistical annotations overlap curves or reference lines, and the overview has unequal plot-area margins. These are transparent examples of the current plotting styles, not collision-free, submission-ready figures.
The v0.3.0 release and its validated tarball are unchanged. This directory is excluded from the R source package; the 50K preparation limitation remains deferred to 0.3.x.